U-Haul 2009 Annual Report Download - page 87
Download and view the complete annual report
Please find page 87 of the 2009 U-Haul annual report below. You can navigate through the pages in the report by either clicking on the pages listed below, or by using the keyword search tool below to find specific information within the annual report.-
 1
1 -
2
-
3
-
4
-
5
-
6
-
7
-
8
-
9
-
10
-
11
-
12
-
13
-
14
-
15
-
16
-
17
-
18
-
19
-
20
-
21
-
22
-
23
-
24
-
25
-
26
-
27
-
28
-
29
-
30
-
31
-
32
-
33
-
34
-
35
-
36
-
37
-
38
-
39
-
40
-
41
-
42
-
43
-
44
-
45
-
46
-
47
-
48
-
49
-
50
-
51
-
52
-
53
-
54
-
55
-
56
-
57
-
58
-
59
-
60
-
61
-
62
-
63
-
64
-
65
-
66
-
67
-
68
-
69
-
70
-
71
-
72
-
73
-
74
-
75
-
76
-
 77
77 -
 78
78 -
 79
79 -
 80
80 -
 81
81 -
 82
82 -
 83
83 -
 84
84 -
 85
85 -
 86
86 -
 87
87 -
 88
88 -
 89
89 -
 90
90 -
 91
91 -
 92
92 -
 93
93 -
 94
94 -
 95
95 -
 96
96 -
 97
97 -
98
-
99
-
100
-
101
-
102
-
103
-
104
-
105
-
106
-
107
-
108
-
109
-
110
-
111
-
112
-
113
-
114
-
115
-
116
-
117
-
118
-
119
-
120
-
121
-
122
-
123
-
124
-
125
-
126
-
127
-
128
 |
 |

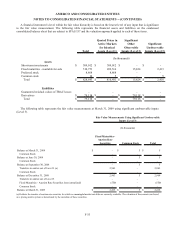
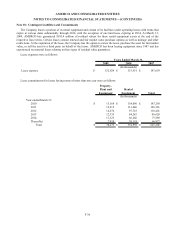
AMERCO AND CONSOLIDATED ENTITIES
NOTES TO CONSOLIDATED FINANCIAL STATEMENTS -- (CONTINUED)
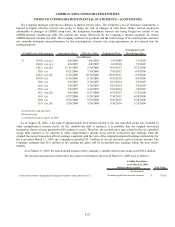
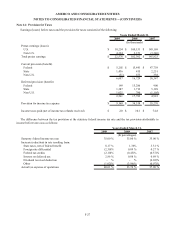
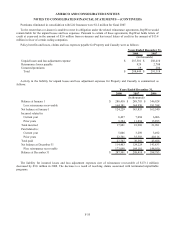
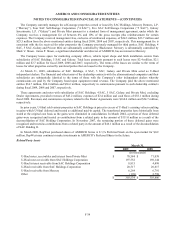
If the estimated health care cost trend rate assumptions were increased by one percent, the accumulated post retirement
benefit obligation as of fiscal year-end would increase by approximately $85,116 and the total of the service cost and
interest cost components would increase by $14,209. A decrease in the estimated health care cost trend rate assumption of
one percent would decrease the accumulated post retirement benefit obligation as of fiscal year-end by $93,740 and the
total of the service cost and interest cost components would decrease by $15,999.
Post employment benefits provided by the Company, other than retirement, are not material.
Future net benefit payments are expected as follows:
Amount
(In thousands)
Year-ended:
2010 $ 595
2011 692
2012 802
2013 899
2014 999
2015 through 2019 5,762
Total $ 9,749
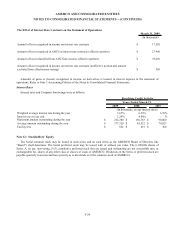
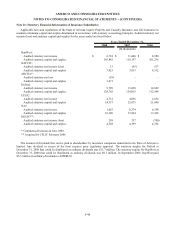
Note 16: Fair Value Measurements
Effective April 1, 2008, assets and liabilities recorded at fair value on the condensed consolidated balance sheet were
measured and classified based upon a three tiered approach to valuation. SFAS 157 requires that financial assets and
liabilities recorded at fair value be classified and disclosed in one of the following three categories:
Level 1 - Unadjusted quoted prices in active markets that are accessible at the measurement date for identical,
unrestricted assets or liabilities;
Level 2 – Quoted prices for identical or similar financial instruments in markets that are not considered to be active, or
similar financial instruments for which all significant inputs are observable, either directly or indirectly, or inputs other than
quoted prices that are observable, or inputs that are derived principally from or corroborated by observable market data
through correlation or other means; or
Level 3 – Prices or valuations that require inputs that are both significant to the fair value measurement and are
unobservable. These reflect management’s assumptions about the assumptions a market participant would use in pricing the
asset or liability.
F-32