U-Haul 2009 Annual Report Download - page 36
Download and view the complete annual report
Please find page 36 of the 2009 U-Haul annual report below. You can navigate through the pages in the report by either clicking on the pages listed below, or by using the keyword search tool below to find specific information within the annual report.-
 1
1 -
2
-
3
-
4
-
5
-
6
-
7
-
8
-
9
-
10
-
11
-
12
-
13
-
14
-
15
-
16
-
17
-
18
-
19
-
20
-
21
-
22
-
23
-
24
-
25
-
 26
26 -
 27
27 -
 28
28 -
 29
29 -
 30
30 -
 31
31 -
 32
32 -
 33
33 -
 34
34 -
 35
35 -
 36
36 -
 37
37 -
 38
38 -
 39
39 -
 40
40 -
 41
41 -
 42
42 -
 43
43 -
 44
44 -
 45
45 -
 46
46 -
47
-
48
-
49
-
50
-
51
-
52
-
53
-
54
-
55
-
56
-
57
-
58
-
59
-
60
-
61
-
62
-
63
-
64
-
65
-
66
-
67
-
68
-
69
-
70
-
71
-
72
-
73
-
74
-
75
-
76
-
77
-
78
-
79
-
80
-
81
-
82
-
83
-
84
-
85
-
86
-
87
-
88
-
89
-
90
-
91
-
92
-
93
-
94
-
95
-
96
-
97
-
98
-
99
-
100
-
101
-
102
-
103
-
104
-
105
-
106
-
107
-
108
-
109
-
110
-
111
-
112
-
113
-
114
-
115
-
116
-
117
-
118
-
119
-
120
-
121
-
122
-
123
-
124
-
125
-
126
-
127
-
128
 |
 |

SAC Holding II
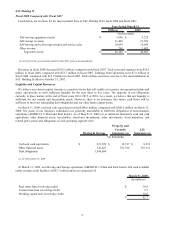
Fiscal 2008 Compared with Fiscal 2007
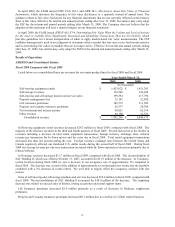
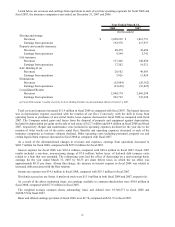
Listed below are revenues for the major product lines at SAC Holding II for fiscal 2008 and fiscal 2007:
2008 (a) 2007
Self-moving equipment rentals $ 5,846 $ 9,225
Self-storage revenues 11,469 19,926
Self-moving and self-storage product and service sales 10,039 16,045
Other revenue 748 1,407
Segment revenue $ 28,102 $ 46,603
(a) Activity for the seven months ended October 2007, prior to deconsolidation.
(In thousands)
Year Ended March 31,
Revenues in fiscal 2008 decreased $18.5 million, compared with fiscal 2007. Total costs and expenses were $20.2
million in fiscal 2008, compared with $32.7 million in fiscal 2007. Earnings from operations were $7.9 million in
fiscal 2008, compared with $13.9 million in fiscal 2007. Each of these decreases was due to the deconsolidation of
SAC Holding II effective October 31, 2007.
Liquidity and Capital Resources
We believe our current capital structure is a positive factor that will enable us to pursue our operational plans and
goals, and provide us with sufficient liquidity for the next three to five years. The majority of our obligations
currently in place mature at the end of fiscal years 2014, 2015 or 2018. As a result, we believe that our liquidity is
sufficient for our current and foreseeable needs. However, there is no assurance that future cash flows will be
sufficient to meet our outstanding debt obligations and our other future capital needs.
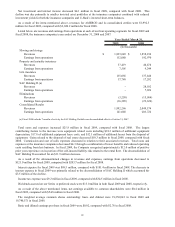
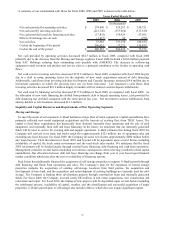
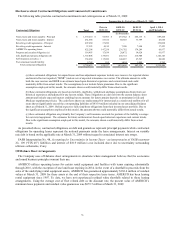
At March 31, 2009, cash and cash equivalents totaled $240.6 million, compared with $206.6 million on March 31,
2008. The assets of our insurance subsidiaries are generally unavailable to fulfill the obligations of non-insurance
operations (AMERCO, U-Haul and Real Estate). As of March 31, 2009 (or as otherwise indicated), cash and cash
equivalents, other financial assets (receivables, short-term investments, other investments, fixed maturities, and
related party assets) and obligations of each operating segment were:
Moving & Storage
Property and
Casualty
Insurance (a)
Life
Insurance (a)
Cash and cash equivalents $ 213,078 $ 19,197 $ 8,312
Other financial assets 341,427 391,706 539,112
Debt obligations 1,546,490 - -
(a) As of December 31, 2008
(In thousands)
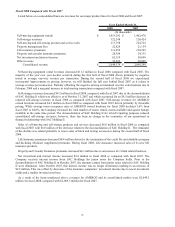
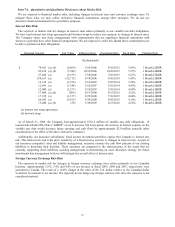
At March 31, 2009, our Moving and Storage operations (AMERCO, U-Haul and Real Estate) had cash available
under existing credit facilities of $42.7 million and were comprised of:
March 31, 2009
(In millions)
Real estate loan (revolving credit) $ 30.0
Construction loan (revolving credit) 2.7
Working capital loan (revolving credit) 10.0
$ 42.7
32