U-Haul 2009 Annual Report Download - page 60
Download and view the complete annual report
Please find page 60 of the 2009 U-Haul annual report below. You can navigate through the pages in the report by either clicking on the pages listed below, or by using the keyword search tool below to find specific information within the annual report.-
 1
1 -
2
-
3
-
4
-
5
-
6
-
7
-
8
-
9
-
10
-
11
-
12
-
13
-
14
-
15
-
16
-
17
-
18
-
19
-
20
-
21
-
22
-
23
-
24
-
25
-
26
-
27
-
28
-
29
-
30
-
31
-
32
-
33
-
34
-
35
-
36
-
37
-
38
-
39
-
40
-
41
-
42
-
43
-
44
-
45
-
46
-
47
-
48
-
49
-
 50
50 -
 51
51 -
 52
52 -
 53
53 -
 54
54 -
 55
55 -
 56
56 -
 57
57 -
 58
58 -
 59
59 -
 60
60 -
 61
61 -
 62
62 -
 63
63 -
 64
64 -
 65
65 -
 66
66 -
 67
67 -
 68
68 -
 69
69 -
 70
70 -
71
-
72
-
73
-
74
-
75
-
76
-
77
-
78
-
79
-
80
-
81
-
82
-
83
-
84
-
85
-
86
-
87
-
88
-
89
-
90
-
91
-
92
-
93
-
94
-
95
-
96
-
97
-
98
-
99
-
100
-
101
-
102
-
103
-
104
-
105
-
106
-
107
-
108
-
109
-
110
-
111
-
112
-
113
-
114
-
115
-
116
-
117
-
118
-
119
-
120
-
121
-
122
-
123
-
124
-
125
-
126
-
127
-
128
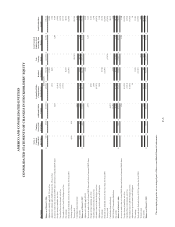
 |
 |

Description
Series A
Common
Stock, $0.25
Par Value
Common
Stock, $0.25
Par Value
Additional Paid-In
Capital
Accumulated Other
Comprehensive
Income (Loss)
Retained
Earnings
Less:
Treasury
Stock
Less: Unearned
Employee Stock
Ownership Plan
Shares
Total Stockholders'
Equity
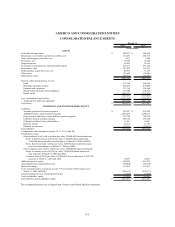
Balance as of March 31, 2006 $ 929 $ 9,568 $ 367,655 $ (28,902) $ 773,784 $ (418,092) $ (9,338) $ 695,604
Adjustment to initially apply SAB 108, net of tax - - - - (1,926) - - (1,926)
Adjustment to initially apply FASB Statement No. 158, net of tax - - - (153) (148) - - (301)
Increase in market value of released ESOP shares and release of unearned ESOP shares - - 3,265 - - - 1,204 4,469
Foreign currency translation, net of tax - - - (1,919) - - - (1,919)
Unrealized loss on investments, net of tax - - - (1,072) - - - (1,072)
Fair market value of cash flow hedges, net of tax - - - (9,733) - - - (9,733)
Net earnings - - - - 90,553 - - 90,553
Preferred stock dividends: Series A ($2.13 per share for fiscal 2007) - - - - (12,963) - - (12,963)
Exchange of shares (929) 929 - - - - - -
Treasury stock - - - - - (49,106) - (49,106)
Contribution from related party - - 4,492 - - - - 4,492
Net activity (929) 929 7,757 (12,877) 75,516 (49,106) 1,204 22,494
Balance as of March 31, 2007 $ - $ 10,497 $ 375,412 $ (41,779) $ 849,300 $ (467,198) $ (8,134) $ 718,098
Adjustment to initially apply FIN 48 - - - - 6,826 - - 6,826
Increase in market value of released ESOP shares and release of unearned ESOP shares - - 2,379 - - - 1,239 3,618
Foreign currency translation, net of tax - - - 8,583 - - - 8,583
Unrealized gain on investments, net of tax - - - 1,946 - - - 1,946
Fair market value of cash flow hedges, net of tax - - - (25,473) - - - (25,473)
Adjustment to post retirement benefit obligation - - - 1,444 - - - 1,444
Net earnings - - - - 67,784 - - 67,784
Preferred stock dividends: Series A ($2.13 per share for fiscal 2008) - - - - (12,963) - - (12,963)
Treasury stock - - - - - (57,479) - (57,479)
Contribution from related party - - 46,071 - - - - 46,071
SAC Holding II Corporation distribution - - (4,492) - 4,468 - - (24)
Net activity - - 43,958 (13,500) 66,115 (57,479) 1,239 40,333
Balance as of March 31, 2008 $ - $ 10,497 $ 419,370 $ (55,279) $ 915,415 $ (524,677) $ (6,895) $ 758,431
Increase in market value of released ESOP shares and release of unearned ESOP shares - - 1,218 - - - 1,230 2,448
Foreign currency translation, net of tax - - - (16,030) - - - (16,030)
Unrealized loss on investments, net of tax - - - (8,914) - - - (8,914)
Fair market value of cash flow hedges, net of tax - - - (17,833) - - - (17,833)
Adjustment to post retirement benefit obligation - - - 56 - - - 56
Net earnings - - - - 13,410 - - 13,410
Preferred stock dividends: Series A ($2.13 per share for fiscal 2009) - - - - (12,963) - - (12,963)
Treasury stock - - - - - (976) - (976)
Net activity - - 1,218 (42,721) 447 (976) 1,230 (40,802)
Balance as of March 31, 2009 $ - $ 10,497 $ 420,588 $ (98,000) $ 915,862 $ (525,653) $ (5,665) $ 717,629
(In thousands)
CONSOLIDATED STATEMENTS OF CHANGES IN STOCKHOLDERS’ EQUITY
AMERCO AND CONSOLIDATED ENTITIES
F-5
The accompanying notes are an integral part of these consolidated financial statements.