U-Haul 2009 Annual Report Download - page 107
Download and view the complete annual report
Please find page 107 of the 2009 U-Haul annual report below. You can navigate through the pages in the report by either clicking on the pages listed below, or by using the keyword search tool below to find specific information within the annual report.-
 1
1 -
2
-
3
-
4
-
5
-
6
-
7
-
8
-
9
-
10
-
11
-
12
-
13
-
14
-
15
-
16
-
17
-
18
-
19
-
20
-
21
-
22
-
23
-
24
-
25
-
26
-
27
-
28
-
29
-
30
-
31
-
32
-
33
-
34
-
35
-
36
-
37
-
38
-
39
-
40
-
41
-
42
-
43
-
44
-
45
-
46
-
47
-
48
-
49
-
50
-
51
-
52
-
53
-
54
-
55
-
56
-
57
-
58
-
59
-
60
-
61
-
62
-
63
-
64
-
65
-
66
-
67
-
68
-
69
-
70
-
71
-
72
-
73
-
74
-
75
-
76
-
77
-
78
-
79
-
80
-
81
-
82
-
83
-
84
-
85
-
86
-
87
-
88
-
89
-
90
-
91
-
92
-
93
-
94
-
95
-
96
-
 97
97 -
 98
98 -
 99
99 -
 100
100 -
 101
101 -
 102
102 -
 103
103 -
 104
104 -
 105
105 -
 106
106 -
 107
107 -
 108
108 -
 109
109 -
 110
110 -
 111
111 -
 112
112 -
 113
113 -
 114
114 -
 115
115 -
 116
116 -
 117
117 -
118
-
119
-
120
-
121
-
122
-
123
-
124
-
125
-
126
-
127
-
128
 |
 |

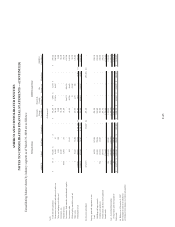
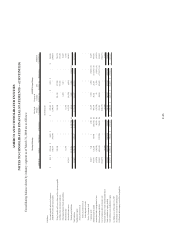
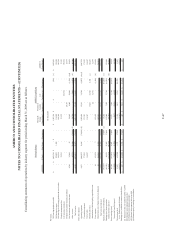
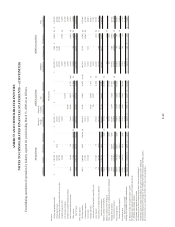
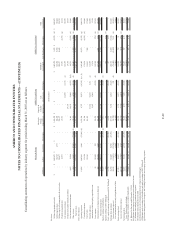
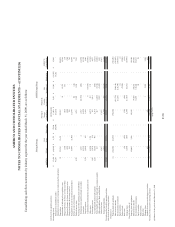
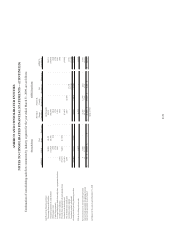
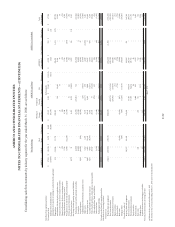
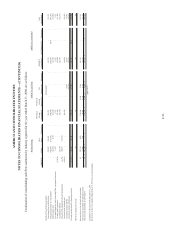
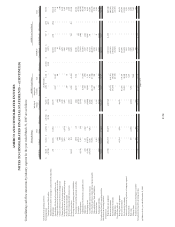
AMERCO AND CONSOLIDATED ENTITIES
NOTES TO CONSOLIDATED FINANCIAL STATEMENTS -- (CONTINUED)
F-52
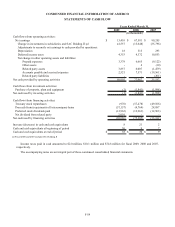
Consolidating cash flow statements by industry segment for the year ended March 31, 2008, are as follows:
AMERCO U-Haul
Real
Estate Elimination
Moving &
Storage
Consolidated
Property &
Casualty
Insurance (a)
Life
Insurance (a) Elimination
AMERCO
Consolidated SAC Holding II (b) Elimination
Total
Consolidated
67,581$ (10,156)$ 6,070$ 4,086$ 67,581$ 5,909$ 13,603$ (19,512)$ 67,581$ 222$ (19)$ 67,784$
(15,648) - - (4,086) (19,734) - - 19,512 (222) - 222 -
515 214,246 11,730 - 226,491 - - - 226,491 1,634 (327) 227,798
- - - - - 190 12,991 - 13,181 - - 13,181
- 23 - - 23 - 53 - 76 - - 76
Change in allowance for losses on mortgage notes - (39) - - (39) - - - (39) - - (39)
Change in allowance for inventory reserve - 2,746 - - 2,746 - - - 2,746 - - 2,746
- 6,450 (12,206) - (5,756) - - - (5,756) (160) - (5,916)
- - - - - 51 241 - 292 - - 292
4,372 91 - - 4,463 4,318 (3,488) - 5,293 146 124 5,563
- (2,209) - - (2,209) (15,081) 766 - (16,524) - - (16,524)
- (2,449) - - (2,449) - - - (2,449) 4 - (2,445)
6,665 (10,847) (203) - (4,385) - - - (4,385) 47 - (4,338)
- - - - - (24) (7,455) - (7,479) - - (7,479)
4 3,602 1,470 - 5,076 (1,117) 290 - 4,249 (1,008) - 3,241
6,007 6,493 12,645 - 25,145 2,842 5,040 - 33,027 5 - 33,032
7,571 4,606 (4,316) - 7,861 - (1,231) - 6,630 680 - 7,310
- 29,747 - - 29,747 77 (9,160) - 20,664 - - 20,664
- - - - - (779) 683 - (96) - - (96)
- (3,948) - - (3,948) - - - (3,948) (48) - (3,996)
- (6,220) - - (6,220) (363) (5,271) - (11,854) 287 - (11,567)
77,067 232,136 15,190 - 324,393 (3,977) 7,062 - 327,478 1,809 - 329,287
(1,841) (507,883) (59,105) - (568,829) - - - (568,829) (1,381) - (570,210)
- - - - - (82,179) (163,166) - (245,345) - - (245,345)
- - - - - (29,692) (53,959) - (83,651) - - (83,651)
- - - - - - (31) - (31) - - (31)
- - - - - - (770) - (770) - - (770)
- - (2,801) - (2,801) (297) - - (3,098) - - (3,098)
- - (497) - (497) (1,650) (11,910) - (14,057) - - (14,057)
- 143,537 22,458 - 165,995 - - - 165,995 391 - 166,386
- - - - - 77,417 168,758 - 246,175 - - 246,175
- - - - - 37,359 94,434 - 131,793 - - 131,793
- - - - - - 46 - 46 - - 46
- - - - - 5,000 625 - 5,625 - - 5,625
- 281 - - 281 631 - - 912 - - 912
- - - - - 8 8,138 - 8,146 - - 8,146
- 117 - - 117 - - - 117 - - 117
(1,841) (363,948) (39,945) - (405,734) 6,597 42,165 - (356,972) (990) - (357,962)
(page 1 of 2)
(b) Activity for the seven months ending October 31, 2007, prior to deconsolidation
Deferred income taxes
Net change in other operating assets and liabilities:
Reinsurance recoverables and trade receivables
AMERCO as Consolidated
Net (gain) loss on sale of real and personal property
Moving & Storage
(In thousands)
AMERCO Legal Group
Inventories
Cash flows from operating activities:
Net earnings (loss)
Earnings from consolidated entities
Depreciation
Amortization of deferred policy acquisition costs
Change in allowance for losses on trade receivables
Adjustments to reconcile net earnings to cash provided by operations:
Net loss on sale of investments
Prepaid expenses
Capitalization of deferred policy acquisition costs
Other assets
Related party assets
Accounts payable and accrued expenses
Policy benefits and losses, claims and loss expenses payable
Other policyholders' funds and liabilities
Deferred income
Related party liabilities
Net cash provided (used) by operating activities
Proceeds from sales of:
Property, plant and equipment
Cash flows from investing activities:
Fixed maturities investments
Equity securities
Purchases of:
Property, plant and equipment
Short term investments
Short term investments
Preferred stock
Fixed maturities investments
Equity securities
Real estate
Mortgage loans
Preferred stock
Real estate
Mortgage loans
Payments from notes and mortgage receivables
Net cash provided (used) by investing activities
(a) Balance for the period ended December 31, 2007