U-Haul 2009 Annual Report Download - page 28
Download and view the complete annual report
Please find page 28 of the 2009 U-Haul annual report below. You can navigate through the pages in the report by either clicking on the pages listed below, or by using the keyword search tool below to find specific information within the annual report.-
 1
1 -
2
-
3
-
4
-
5
-
6
-
7
-
8
-
9
-
10
-
11
-
12
-
13
-
14
-
15
-
16
-
17
-
 18
18 -
 19
19 -
 20
20 -
 21
21 -
 22
22 -
 23
23 -
 24
24 -
 25
25 -
 26
26 -
 27
27 -
 28
28 -
 29
29 -
 30
30 -
 31
31 -
 32
32 -
 33
33 -
 34
34 -
 35
35 -
 36
36 -
 37
37 -
 38
38 -
39
-
40
-
41
-
42
-
43
-
44
-
45
-
46
-
47
-
48
-
49
-
50
-
51
-
52
-
53
-
54
-
55
-
56
-
57
-
58
-
59
-
60
-
61
-
62
-
63
-
64
-
65
-
66
-
67
-
68
-
69
-
70
-
71
-
72
-
73
-
74
-
75
-
76
-
77
-
78
-
79
-
80
-
81
-
82
-
83
-
84
-
85
-
86
-
87
-
88
-
89
-
90
-
91
-
92
-
93
-
94
-
95
-
96
-
97
-
98
-
99
-
100
-
101
-
102
-
103
-
104
-
105
-
106
-
107
-
108
-
109
-
110
-
111
-
112
-
113
-
114
-
115
-
116
-
117
-
118
-
119
-
120
-
121
-
122
-
123
-
124
-
125
-
126
-
127
-
128
 |
 |

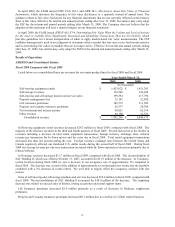
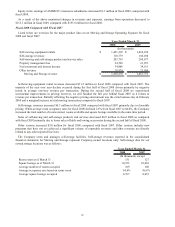
Net investment and interest income decreased $4.1 million in fiscal 2009, compared with fiscal 2008. This
decline was due primarily to smaller invested asset portfolios at the insurance companies combined with reduced
investment yields for both the insurance companies and U-Haul’s invested short-term balances.
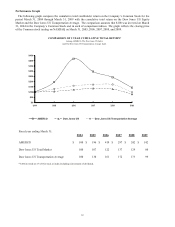
As a result of the items mentioned above, revenues for AMERCO and its consolidated entities were $1,992.3
million for fiscal 2009, compared with $2,049.2 million for fiscal 2008.
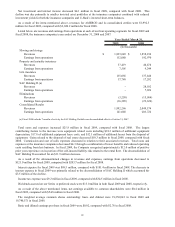
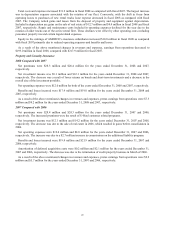
Listed below are revenues and earnings from operations at each of our four operating segments for fiscal 2009 and
fiscal 2008, the insurance companies years ended are December 31, 2008 and 2007.
2009 2008
Moving and storage
Revenues $ 1,823,049 $ 1,858,230
Earnings from operations 112,080 192,970
Property and casualty insurance
Revenues 37,419 40,478
Earnings from operations 7,505 9,244
Life insurance
Revenues 135,056 137,448
Earnings from operations 17,748 17,202
SAC Holding II (a)
Revenues - 28,102
Earnings from operations - 7,926
Eliminations
Revenues (3,258) (15,084)
Earnings from operations (16,285) (23,620)
Consolidated Results
Revenues 1,992,266 2,049,174
Earnings from operations 121,048 203,722
(a) Fiscal 2008 includes 7 months of activity for SAC Holding II which was deconsolidated effective October 31, 2007.
(In thousands)
Year Ended March 31,
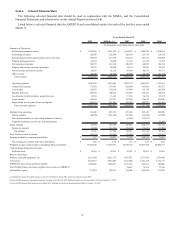
Total costs and expenses increased $25.8 million in fiscal 2009, compared with fiscal 2008. The largest
contributing factors to the increase were equipment related costs including $18.2 million of additional equipment
depreciation, $17.8 of additional equipment lease costs, and $12.1 million of additional losses from the disposal of
equipment. Gains related to the disposal of real estate decreased $10.3 million in fiscal 2009, compared with fiscal
2008. Commission and cost of sales expenses decreased in relation to their associated revenues. Total costs and
expenses at the insurance companies decreased $4.3 through a combination of lower benefits and reduced operating
costs resulting from less business. In fiscal 2009, the Company recognized approximately $12.0 million of positive
prior year experience on its portion of the self-insured liability risk related to the rental fleet. The deconsolidation of
SAC Holding II accounted for an $11.9 million decrease.
As a result of the aforementioned changes in revenues and expenses, earnings from operations decreased to
$121.0 million for fiscal 2009, compared with $203.7 million for fiscal 2008.
Interest expense for fiscal 2009 was $98.5 million, compared with $101.4 million in fiscal 2008. The decrease in
interest expense in fiscal 2009 was primarily related to the deconsolidation of SAC Holding II which accounted for
$3.5 million of the decline.
Income tax expense was $9.2 million in fiscal 2009, compared with $34.5 million in fiscal 2008.
Dividends accrued on our Series A preferred stock were $13.0 million in both fiscal 2009 and 2008, respectively.
As a result of the above mentioned items, net earnings available to common shareholders were $0.4 million in
fiscal 2009, compared with $54.8 million in fiscal 2008.
The weighted average common shares outstanding: basic and diluted were 19,350,041 in fiscal 2009 and
19,740,571 in fiscal 2008.
Basic and diluted earnings per share in fiscal 2009 were $0.02, compared with $2.78 in fiscal 2008.
24