TD Bank 2014 Annual Report Download - page 6
Download and view the complete annual report
Please find page 6 of the 2014 TD Bank annual report below. You can navigate through the pages in the report by either clicking on the pages listed below, or by using the keyword search tool below to find specific information within the annual report.-
 1
1 -
 2
2 -
 3
3 -
 4
4 -
 5
5 -
 6
6 -
 7
7 -
 8
8 -
 9
9 -
 10
10 -
 11
11 -
 12
12 -
 13
13 -
 14
14 -
 15
15 -
 16
16 -
 17
17 -
18
-
19
-
20
-
21
-
22
-
23
-
24
-
25
-
26
-
27
-
28
-
29
-
30
-
31
-
32
-
33
-
34
-
35
-
36
-
37
-
38
-
39
-
40
-
41
-
42
-
43
-
44
-
45
-
46
-
47
-
48
-
49
-
50
-
51
-
52
-
53
-
54
-
55
-
56
-
57
-
58
-
59
-
60
-
61
-
62
-
63
-
64
-
65
-
66
-
67
-
68
-
69
-
70
-
71
-
72
-
73
-
74
-
75
-
76
-
77
-
78
-
79
-
80
-
81
-
82
-
83
-
84
-
85
-
86
-
87
-
88
-
89
-
90
-
91
-
92
-
93
-
94
-
95
-
96
-
97
-
98
-
99
-
100
-
101
-
102
-
103
-
104
-
105
-
106
-
107
-
108
-
109
-
110
-
111
-
112
-
113
-
114
-
115
-
116
-
117
-
118
-
119
-
120
-
121
-
122
-
123
-
124
-
125
-
126
-
127
-
128
-
129
-
130
-
131
-
132
-
133
-
134
-
135
-
136
-
137
-
138
-
139
-
140
-
141
-
142
-
143
-
144
-
145
-
146
-
147
-
148
-
149
-
150
-
151
-
152
-
153
-
154
-
155
-
156
-
157
-
158
-
159
-
160
-
161
-
162
-
163
-
164
-
165
-
166
-
167
-
168
-
169
-
170
-
171
-
172
-
173
-
174
-
175
-
176
-
177
-
178
-
179
-
180
-
181
-
182
-
183
-
184
-
185
-
186
-
187
-
188
-
189
-
190
-
191
-
192
-
193
-
194
-
195
-
196
-
197
-
198
-
199
-
200
-
201
-
202
-
203
-
204
-
205
-
206
-
207
-
208
-
209
-
210
-
211
-
212
-
213
-
214
-
215
-
216
-
217
-
218
-
219
-
220
-
221
-
222
-
223
-
224
-
225
-
226
-
227
-
228
 |
 |

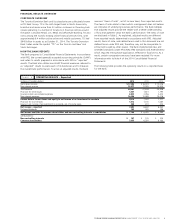
TD BANK GROUP ANNUAL REPORT 2014 PERFORMANCE INDICATORS4
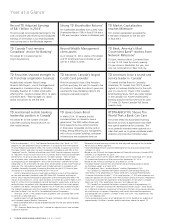
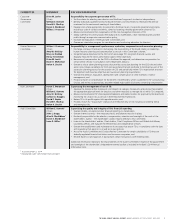
Performance Indicators
Performance indicators focus effort, communicate our priorities, and benchmark TD’s performance as we
strive to be The Better Bank. The following table highlights our performance against these indicators.
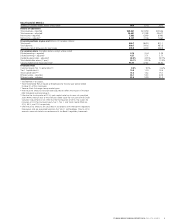
2014 PERFORMANCE INDICATORS
FINANCIAL
• Deliver above-peer-average total shareholder return2
• Grow earnings per share (EPS) by 7 to 10%
• Deliver above-peer-average return on risk-weighted assets3
BUSINESS OPERATIONS
• Grow revenue faster than expenses
• Invest in core businesses to enhance customer experience
CUSTOMER
• Improve Customer Experience Index (CEI)4 scores
• Invest in core businesses to enhance customer experience
EMPLOYEE
• Improve employee engagement score year-over-year
• Enhance the employee experience by:
– Listening to our employees
– Building employment diversity
– Providing a healthy, safe, and flexible work environment
– Providing competitive pay, benefits, and performance-
based compensation
– Investing in training and development
COMMUNITY
• Donate minimum of 1% of domestic pre-tax profits
(five-year average) to charitable and not-for-profit organizations
• Make positive contributions by:
– Supporting employees’ community involvement and
fundraising efforts
– Supporting advancements in our areas of focus, which include
education and financial literacy, creating opportunities for
young people, creating opportunities for affordable housing,
and the environment
– Protecting and preserving the environment
RESULTS1
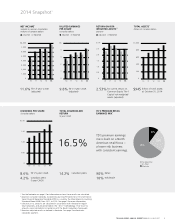
• 20.1% vs. Canadian peer average of 17.4%
• 15.1% EPS growth (8.4% after adding back the additional
insurance charges recorded last year)
• 2.53% vs. Canadian peer average of 2.29%3
• Total revenue growth of 9.2% vs. total expense growth of 10.2%
•
Refer to “Business Segment Analysis” in the 2014 MD&A for details
• CEI score 33.6% (target 32.6%)
•
Refer to “Business Segment Analysis” in the 2014 MD&A for details
• Employee engagement score5 was 4.20 in 2014 vs. 4.17 in 2013
• See TD’s 2014 Corporate Responsibility Report available April 2015
• 1.3% or $56.7 million, in donations and community sponsorships
in Canada vs. 1.3%, or $50.9 million, in 20136
• US$22.3 million in donations and community sponsorships in the
U.S. vs. US$22.9 million in 2013
• £60,244 in donations and community sponsorships in the U.K.
vs. £54,929 in 2013
• $288,000 in domestic employee volunteer grants to 460 different
organizations
• $32.2 million, or 56.8%, of our community giving was directed
to promote our areas of focus domestically
• $4.9 million distributed to 1065 community environmental
projects through TD Friends of the Environment Foundation;
an additional $8.4 million from TD‘s community giving budget
was used to support environmental projects
1
Performance indicators that include an earnings component are based on TD’s
full-year adjusted results (except as noted) as explained in footnote 1 on page 2.
For peers, earnings have been adjusted on a comparable basis to exclude identified
non-underlying items.
2
Total shareholder return is measured on a one-year basis from November 1, 2013
to October 31, 2014.
3
Return on Common Equity Tier 1 Capital (CET1) risk-weighted assets (RWA)
measured year-to-date as at October 31, 2014, for comparison purposes. TD’s
return on CET1 risk-weighted assets for 2014 was 2.53%. Effective the third
quarter of 2014, each capital ratio has its own RWA measure due to OSFI
prescribed scalar for inclusion of the Credit Valuation Adjustment (CVA). Effective
the third quarter of 2014, the scalars for inclusion of CVA for CET1, Tier 1, and
Total Capital RWA are 57%, 65%, and 77%, respectively.
4
CEI is a measurement program that tracks TD customers’ loyalty and advocacy.
5
Scale for employee engagement score is from one to five.
6
Calculated based on Canadian cash donations/five-year rolling average domestic
net income before tax.