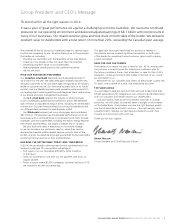
TD Bank 2014 Annual Report Download - page 17
Download and view the complete annual report
Please find page 17 of the 2014 TD Bank annual report below. You can navigate through the pages in the report by either clicking on the pages listed below, or by using the keyword search tool below to find specific information within the annual report.-
 1
1 -
2
-
3
-
4
-
5
-
6
-
 7
7 -
 8
8 -
 9
9 -
 10
10 -
 11
11 -
 12
12 -
 13
13 -
 14
14 -
 15
15 -
 16
16 -
 17
17 -
 18
18 -
 19
19 -
 20
20 -
 21
21 -
 22
22 -
 23
23 -
 24
24 -
 25
25 -
 26
26 -
 27
27 -
28
-
29
-
30
-
31
-
32
-
33
-
34
-
35
-
36
-
37
-
38
-
39
-
40
-
41
-
42
-
43
-
44
-
45
-
46
-
47
-
48
-
49
-
50
-
51
-
52
-
53
-
54
-
55
-
56
-
57
-
58
-
59
-
60
-
61
-
62
-
63
-
64
-
65
-
66
-
67
-
68
-
69
-
70
-
71
-
72
-
73
-
74
-
75
-
76
-
77
-
78
-
79
-
80
-
81
-
82
-
83
-
84
-
85
-
86
-
87
-
88
-
89
-
90
-
91
-
92
-
93
-
94
-
95
-
96
-
97
-
98
-
99
-
100
-
101
-
102
-
103
-
104
-
105
-
106
-
107
-
108
-
109
-
110
-
111
-
112
-
113
-
114
-
115
-
116
-
117
-
118
-
119
-
120
-
121
-
122
-
123
-
124
-
125
-
126
-
127
-
128
-
129
-
130
-
131
-
132
-
133
-
134
-
135
-
136
-
137
-
138
-
139
-
140
-
141
-
142
-
143
-
144
-
145
-
146
-
147
-
148
-
149
-
150
-
151
-
152
-
153
-
154
-
155
-
156
-
157
-
158
-
159
-
160
-
161
-
162
-
163
-
164
-
165
-
166
-
167
-
168
-
169
-
170
-
171
-
172
-
173
-
174
-
175
-
176
-
177
-
178
-
179
-
180
-
181
-
182
-
183
-
184
-
185
-
186
-
187
-
188
-
189
-
190
-
191
-
192
-
193
-
194
-
195
-
196
-
197
-
198
-
199
-
200
-
201
-
202
-
203
-
204
-
205
-
206
-
207
-
208
-
209
-
210
-
211
-
212
-
213
-
214
-
215
-
216
-
217
-
218
-
219
-
220
-
221
-
222
-
223
-
224
-
225
-
226
-
227
-
228
 |
 |

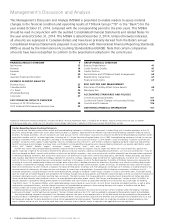
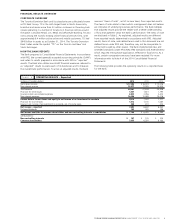
TD BANK GROUP ANNUAL REPORT 2014 MANAGEMENT’S DISCUSSION AND ANALYSIS 15
(millions of Canadian dollars, except as noted) 2014
2013
2012
Average Average Average Average Average Average
balance Interest3 rate balance Interest3 rate balance Interest3 rate
Interest-earning assets
Interest-bearing deposits with Banks
Canada $ 3,692 $ 17 0.46% $ 4,552 $ 23 0.51% $ 8,950 $ 41 0.46%
U.S. 27,179 30 0.11 17,748 32 0.18 13,580 42 0.31
Securities
Trading
Canada 55,383 1,367 2.47 54,390 1,398 2.57 48,342 1,332 2.76
U.S. 18,424 333 1.81 16,781 321 1.91 13,201 231 1.75
Non-trading
Canada 23,169 377 1.63 20,554 336 1.63 18,855 288 1.53
U.S. 76,245 1,370 1.80 66,675 1,384 2.08 66,089 1,671 2.53
Securities purchased under reverse
repurchase agreements
Canada 29,665 288 0.97 24,207 230 0.95 25,944 249 0.96
U.S. 35,232 62 0.18 31,422 94 0.30 27,025 90 0.33
Loans
Mortgages4
Canada 188,664 5,571 2.95 176,856 5,390 3.05 163,016 5,141 3.15
U.S. 45,787 1,713 3.74 41,744 1,710 4.10 36,910 1,671 4.53
Consumer instalment and other personal
Canada 90,512 4,499 4.97 91,729 4,718 5.14 93,622 5,270 5.63
U.S. 29,272 1,058 3.61 26,206 1,016 3.88 22,568 1,018 4.51
Credit card
Canada 17,984 2,245 12.48 14,582 1,828 12.54 14,128 1,699 12.03
U.S. 7,200 1,287 17.88 4,697 834 17.76 1,043 124 11.89
Business and government4
Canada 44,512 1,449 3.26 43,025 1,243 2.89 32,287 1,111 3.44
U.S. 41,233 1,495 3.63 33,452 1,340 4.01 29,451 1,362 4.62
International 68,898 767 1.11 62,180 718 1.15 59,101 898 1.52
Total interest-earning assets $ 803,051 $ 23,928 2.98% $ 730,800 $ 22,615 3.09% $ 674,112 $ 22,238 3.30%
Interest-bearing liabilities
Deposits
Personal
Canada $ 172,897 $ 1,394 0.81% $ 168,369 $ 1,660 0.99% $ 160,947 $ 1,819 1.13%
U.S. 147,025 197 0.13 130,378 211 0.16 119,605 264 0.22
Banks
Canada 5,898 18 0.31 6,134 11 0.18 4,984 28 0.56
U.S. 7,682 16 0.21 6,565 14 0.21 5,278 10 0.19
Business and government5,6
Canada 145,233 1,540 1.06 120,426 1,270 1.05 113,066 1,303 1.15
U.S. 125,375 1,065 0.85 111,787 1,248 1.12 88,962 1,226 1.38
Subordinated notes and debentures 7,964 412 5.17 8,523 447 5.24 11,509 612 5.32
Obligations related to securities sold
short and under repurchase agreements
Canada 43,334 535 1.23 40,874 472 1.15 37,875 432 1.14
U.S. 42,682 122 0.29 37,534 102 0.27 30,161 96 0.32
Securitization liabilities7 41,745 777 1.86 50,591 927 1.83 53,032 1,026 1.93
Other liabilities8,9
Canada 5,652 88 1.56 5,625 82 1.46 7,624 249 3.27
U.S. 29 1 3.45 72 3 4.17 152 3 1.97
International 32,077 179 0.56 19,766 94 0.48 17,964 144 0.80
Total interest-bearing liabilities $ 777,593 $ 6,344 0.82% $ 706,644 $ 6,541 0.93% $ 651,159 $ 7,212 1.11%
Total net interest income on
average earning assets $ 803,051 $ 17,584 2.19% $ 730,800 $ 16,074 2.20% $ 674,112 $ 15,026 2.23%
NET INTEREST INCOME ON AVERAGE EARNING BALANCES1,2
TABLE 7
1 Net interest income includes dividends on securities.
2 Geographic classification of assets and liabilities is based on the domicile of the
booking point of assets and liabilities.
3 Interest income includes loan fees earned by the Bank, which are recognized in net
interest income over the life of the loan through the effective interest rate method.
4 Includes trading loans that the Bank intends to sell immediately or in the near
term with a fair value of $37 million (2013 – $24 million, 2012 – $25 million) and
amortized cost of $36 million (2013 – $24 million, 2012 – $25 million), and loans
designated at fair value through profit or loss of $5 million (2013 – $9 million,
2012 – $13 million) and amortized cost of nil (2013 – nil, 2012 – nil).
5 Includes trading deposits with a fair value of $59 billion (2013 – $51 billion,
2012 – $39 billion).
6 Includes marketing fees incurred on the TD Ameritrade Insured Deposit Accounts
(IDA) of $895 million (2013 – $821 million, 2012 – $834 million).
7 Includes securitization liabilities designated at fair value through profit or loss
of $11 billion (2013 – $22 billion, 2012 – $25 billion) and related amortized cost
of $11 billion (2013 – $22 billion, 2012 – $25 billion). Also includes securitization
liabilities at amortized cost of $25 billion (2013 – $25 billion, 2012 – $25 billion).
8 Other liabilities includes asset-backed commercial paper and term notes with an
amortized cost of $5 billion (2013 – $5 billion, 2012 – $5 billion).
9 Certain comparative amounts have been reclassified to conform with the
presentation adopted in the current year.