TD Bank 2014 Annual Report Download - page 15
Download and view the complete annual report
Please find page 15 of the 2014 TD Bank annual report below. You can navigate through the pages in the report by either clicking on the pages listed below, or by using the keyword search tool below to find specific information within the annual report.-
 1
1 -
2
-
3
-
4
-
 5
5 -
 6
6 -
 7
7 -
 8
8 -
 9
9 -
 10
10 -
 11
11 -
 12
12 -
 13
13 -
 14
14 -
 15
15 -
 16
16 -
 17
17 -
 18
18 -
 19
19 -
 20
20 -
 21
21 -
 22
22 -
 23
23 -
 24
24 -
 25
25 -
26
-
27
-
28
-
29
-
30
-
31
-
32
-
33
-
34
-
35
-
36
-
37
-
38
-
39
-
40
-
41
-
42
-
43
-
44
-
45
-
46
-
47
-
48
-
49
-
50
-
51
-
52
-
53
-
54
-
55
-
56
-
57
-
58
-
59
-
60
-
61
-
62
-
63
-
64
-
65
-
66
-
67
-
68
-
69
-
70
-
71
-
72
-
73
-
74
-
75
-
76
-
77
-
78
-
79
-
80
-
81
-
82
-
83
-
84
-
85
-
86
-
87
-
88
-
89
-
90
-
91
-
92
-
93
-
94
-
95
-
96
-
97
-
98
-
99
-
100
-
101
-
102
-
103
-
104
-
105
-
106
-
107
-
108
-
109
-
110
-
111
-
112
-
113
-
114
-
115
-
116
-
117
-
118
-
119
-
120
-
121
-
122
-
123
-
124
-
125
-
126
-
127
-
128
-
129
-
130
-
131
-
132
-
133
-
134
-
135
-
136
-
137
-
138
-
139
-
140
-
141
-
142
-
143
-
144
-
145
-
146
-
147
-
148
-
149
-
150
-
151
-
152
-
153
-
154
-
155
-
156
-
157
-
158
-
159
-
160
-
161
-
162
-
163
-
164
-
165
-
166
-
167
-
168
-
169
-
170
-
171
-
172
-
173
-
174
-
175
-
176
-
177
-
178
-
179
-
180
-
181
-
182
-
183
-
184
-
185
-
186
-
187
-
188
-
189
-
190
-
191
-
192
-
193
-
194
-
195
-
196
-
197
-
198
-
199
-
200
-
201
-
202
-
203
-
204
-
205
-
206
-
207
-
208
-
209
-
210
-
211
-
212
-
213
-
214
-
215
-
216
-
217
-
218
-
219
-
220
-
221
-
222
-
223
-
224
-
225
-
226
-
227
-
228
 |
 |

TD BANK GROUP ANNUAL REPORT 2014 MANAGEMENT’S DISCUSSION AND ANALYSIS 13
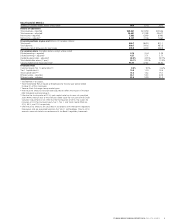
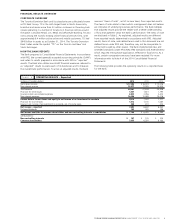
Impact of Foreign Exchange Rate on U.S. Retail Translated Earnings
U.S. Retail earnings, including the contribution from the Bank’s invest-
ment in TD Ameritrade, are impacted by fluctuations in the U.S. dollar
to Canadian dollar exchange rate.
Depreciation of the Canadian dollar had a favourable impact on
consolidated earnings for the year ended October 31, 2014, compared
with last year, as shown in the following table.
FINANCIAL RESULTS OVERVIEW
Net Income
AT A GLANCE OVERVIEW
• Reported net income was $7,883 million, an increase
of $1,243 million, or 19%, compared with last year.
• Adjusted net income was $8,127 million, an increase
of $991 million, or 14%, compared with last year.
Reported net income for the year was $7,883 million, an increase
of $1,243 million, or 19%, compared with $6,640 million last year.
Adjusted net income for the year was $8,127 million, an increase of
$991 million, or 14%, compared with $7,136 million last year. The
increase in adjusted net income was due to higher earnings in the
Canadian Retail, Wholesale Banking, and U.S. Retail segments, partially
offset by a decrease in the Corporate segment. Canadian Retail net
income increased primarily due to loan and deposit volume growth,
the acquisition of certain CIBC Aeroplan credit card accounts and the
related affinity agreement with Aimia, Inc. (collectively, “Aeroplan”),
strong wealth asset growth, and higher insurance earnings, partially
offset by higher expenses. Wholesale Banking net income increased
primarily due to higher revenue, partially offset by higher expenses
and a higher effective tax rate. U.S. Retail net income increased
primarily due to strong organic growth, favourable credit performance,
the acquisition of the credit card portfolio of Target and related
program agreement (collectively, “Target”), the acquisition of Epoch
Investment Partners, Inc. (Epoch), and the impact of foreign currency
translation, partially offset by lower gains on sales of securities and
debt securities classified as loans, and margin compression. Corporate
segment loss increased primarily due to higher net corporate expenses
as a result of ongoing investment in enterprise and regulatory projects
and productivity initiatives.
Reported diluted earnings per share for the year were $4.14, a 20%
increase, compared with $3.44 last year. Adjusted diluted earnings per
share for the year were $4.27, a 15% increase, compared with $3.71
last year. Excluding certain losses in insurance earnings due to addi-
tional losses last year as a result of strengthened reserves for general
insurance automobile claims and claims resulting from severe weather-
related events, diluted earnings per share for the year increased 13%
on a reported basis and increased 8% on an adjusted basis.
(millions of Canadian dollars, except as noted) 2014 2013
vs. 2013 vs. 2012
U.S. Retail (including TD Ameritrade)
Increased total revenue – reported $ 570 $ 118
Increased total revenue – adjusted 570 118
Increased non-interest expenses – reported 370 78
Increased non-interest expenses – adjusted 370 80
Increased net income – reported, after tax 143 26
Increased net income – adjusted, after tax 143 26
Increase in basic earnings per share –
reported (dollars) $ 0.08 $ 0.01
Increase in basic earnings per share –
adjusted (dollars) 0.08 0.01
A one cent increase/decrease in the U.S. dollar to Canadian dollar
exchange rate would have decreased/increased total Bank annual net
income by approximately $23 million.
IMPACT OF FOREIGN EXCHANGE RATE
ON U.S. RETAIL TRANSLATED EARNINGS
TABLE 6