TD Bank 2014 Annual Report Download - page 5
Download and view the complete annual report
Please find page 5 of the 2014 TD Bank annual report below. You can navigate through the pages in the report by either clicking on the pages listed below, or by using the keyword search tool below to find specific information within the annual report.-
 1
1 -
 2
2 -
 3
3 -
 4
4 -
 5
5 -
 6
6 -
 7
7 -
 8
8 -
 9
9 -
 10
10 -
 11
11 -
 12
12 -
 13
13 -
 14
14 -
 15
15 -
 16
16 -
17
-
18
-
19
-
20
-
21
-
22
-
23
-
24
-
25
-
26
-
27
-
28
-
29
-
30
-
31
-
32
-
33
-
34
-
35
-
36
-
37
-
38
-
39
-
40
-
41
-
42
-
43
-
44
-
45
-
46
-
47
-
48
-
49
-
50
-
51
-
52
-
53
-
54
-
55
-
56
-
57
-
58
-
59
-
60
-
61
-
62
-
63
-
64
-
65
-
66
-
67
-
68
-
69
-
70
-
71
-
72
-
73
-
74
-
75
-
76
-
77
-
78
-
79
-
80
-
81
-
82
-
83
-
84
-
85
-
86
-
87
-
88
-
89
-
90
-
91
-
92
-
93
-
94
-
95
-
96
-
97
-
98
-
99
-
100
-
101
-
102
-
103
-
104
-
105
-
106
-
107
-
108
-
109
-
110
-
111
-
112
-
113
-
114
-
115
-
116
-
117
-
118
-
119
-
120
-
121
-
122
-
123
-
124
-
125
-
126
-
127
-
128
-
129
-
130
-
131
-
132
-
133
-
134
-
135
-
136
-
137
-
138
-
139
-
140
-
141
-
142
-
143
-
144
-
145
-
146
-
147
-
148
-
149
-
150
-
151
-
152
-
153
-
154
-
155
-
156
-
157
-
158
-
159
-
160
-
161
-
162
-
163
-
164
-
165
-
166
-
167
-
168
-
169
-
170
-
171
-
172
-
173
-
174
-
175
-
176
-
177
-
178
-
179
-
180
-
181
-
182
-
183
-
184
-
185
-
186
-
187
-
188
-
189
-
190
-
191
-
192
-
193
-
194
-
195
-
196
-
197
-
198
-
199
-
200
-
201
-
202
-
203
-
204
-
205
-
206
-
207
-
208
-
209
-
210
-
211
-
212
-
213
-
214
-
215
-
216
-
217
-
218
-
219
-
220
-
221
-
222
-
223
-
224
-
225
-
226
-
227
-
228
 |
 |

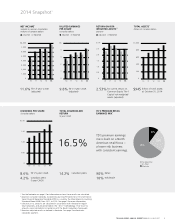
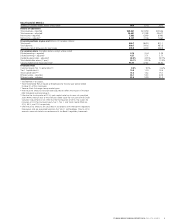
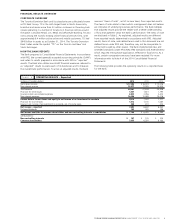
TD BANK GROUP ANNUAL REPORT 2014 YEAR AT A GLANCE 3
Key Financial Metrics
(millions of Canadian dollars, except where noted) 2014 2013 2012
Results of operations
Total revenues – reported $29,961 $27,259 $25,546
Total revenues – adjusted1 29,681 27,188 25,677
Net income – reported 7,883 6,640 6,460
Net income – adjusted1 8,127 7,136 7,064
Financial positions at year-end (billions of Canadian dollars)
Total assets 944.7 862.0 811.1
Total deposits 600.7 541.6 487.8
Total loans net of allowance for loan losses 478.9 444.9 408.8
Per common share (Canadian dollars, except where noted)
Diluted earnings – reported 4.14 3.44 3.38
Diluted earnings – adjusted1 4.27 3.71 3.71
Dividend payout ratio – adjusted1 43.0% 43.5% 38.7%
Total shareholder return (1 year)2 20.1% 22.3% 11.9%
Closing market price (fiscal year end)3 55.47 47.82 40.62
Financial ratios
Common Equity Tier 1 Capital ratio4,5,6 9.4% 9.0% n /a %
Tier 1 Capital ratio4,5,6 10.9 11.0 12.6
Total Capital ratio4,5,6 13.4 14.2 15.7
Efficiency ratio – reported 55.1 55.3 54.9
Efficiency ratio – adjusted 53.4 52.9 51.3
1
See footnote 1 on page 2.
2
Total Shareholder Return based on Bloomberg for the one year period ended
October 31 of the stated year.
3
Toronto Stock Exchange closing market price.
4
Prior to 2014, amounts have not been adjusted to reflect the impact of the New
IFRS Standards and Amendments.
5
Effective the third quarter of 2014, each capital ratio has its own risk-weighted
asset (RWA) measure due to the OSFI prescribed scalar for inclusion of the Credit
Valuation Adjustment (CVA). Effective the third quarter of 2014, the scalars for
inclusion of CVA for Common Equity Tier 1, Tier 1, and Total Capital RWA are
57%, 65%, and 77% respectively.
6
Effective 2013, amounts are calculated in accordance with the Basel III regulatory
framework, and are presented based on the “all-in” methodology. Prior to 2013,
amounts were calculated in accordance with the Basel II regulatory framework.