TD Bank 2014 Annual Report Download - page 19
Download and view the complete annual report
Please find page 19 of the 2014 TD Bank annual report below. You can navigate through the pages in the report by either clicking on the pages listed below, or by using the keyword search tool below to find specific information within the annual report.-
 1
1 -
2
-
3
-
4
-
5
-
6
-
7
-
8
-
 9
9 -
 10
10 -
 11
11 -
 12
12 -
 13
13 -
 14
14 -
 15
15 -
 16
16 -
 17
17 -
 18
18 -
 19
19 -
 20
20 -
 21
21 -
 22
22 -
 23
23 -
 24
24 -
 25
25 -
 26
26 -
 27
27 -
 28
28 -
 29
29 -
30
-
31
-
32
-
33
-
34
-
35
-
36
-
37
-
38
-
39
-
40
-
41
-
42
-
43
-
44
-
45
-
46
-
47
-
48
-
49
-
50
-
51
-
52
-
53
-
54
-
55
-
56
-
57
-
58
-
59
-
60
-
61
-
62
-
63
-
64
-
65
-
66
-
67
-
68
-
69
-
70
-
71
-
72
-
73
-
74
-
75
-
76
-
77
-
78
-
79
-
80
-
81
-
82
-
83
-
84
-
85
-
86
-
87
-
88
-
89
-
90
-
91
-
92
-
93
-
94
-
95
-
96
-
97
-
98
-
99
-
100
-
101
-
102
-
103
-
104
-
105
-
106
-
107
-
108
-
109
-
110
-
111
-
112
-
113
-
114
-
115
-
116
-
117
-
118
-
119
-
120
-
121
-
122
-
123
-
124
-
125
-
126
-
127
-
128
-
129
-
130
-
131
-
132
-
133
-
134
-
135
-
136
-
137
-
138
-
139
-
140
-
141
-
142
-
143
-
144
-
145
-
146
-
147
-
148
-
149
-
150
-
151
-
152
-
153
-
154
-
155
-
156
-
157
-
158
-
159
-
160
-
161
-
162
-
163
-
164
-
165
-
166
-
167
-
168
-
169
-
170
-
171
-
172
-
173
-
174
-
175
-
176
-
177
-
178
-
179
-
180
-
181
-
182
-
183
-
184
-
185
-
186
-
187
-
188
-
189
-
190
-
191
-
192
-
193
-
194
-
195
-
196
-
197
-
198
-
199
-
200
-
201
-
202
-
203
-
204
-
205
-
206
-
207
-
208
-
209
-
210
-
211
-
212
-
213
-
214
-
215
-
216
-
217
-
218
-
219
-
220
-
221
-
222
-
223
-
224
-
225
-
226
-
227
-
228
 |
 |

TD BANK GROUP ANNUAL REPORT 2014 MANAGEMENT’S DISCUSSION AND ANALYSIS 17
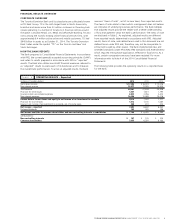
NON-INTEREST INCOME1
TABLE 9
TRADING-RELATED INCOME
TABLE 10
(millions of Canadian dollars, except as noted) 2014 vs. 2013
2014 2013 2012 % change
Investment and securities services
TD Waterhouse fees and commissions $ 412 $ 406 $ 384 1%
Full-service brokerage and other securities services 684 596 562 15
Underwriting and advisory 482 365 437 32
Investment management fees 413 326 241 27
Mutual fund management 1,355 1,141 997 19
Total investment and securities services 3,346 2,834 2,621 18
Credit fees 845 785 745 8
Net securities gains (losses) 173 304 373 (43)
Trading income (losses) (349) (279) (41) (25)
Service charges 2,152 1,966 1,849 9
Card services 1,552 1,220 942 27
Insurance revenue 3,883 3,734 3,537 4
Trust fees 150 148 149 1
Other income (loss) 625 473 345 32
Total $ 12,377 $ 11,185 $ 10,520 11%
(millions of Canadian dollars) 2014 2013 2012
Net interest income $ 1,337 $ 1,231 $ 1,050
Trading income (loss) (349) (279) (41)
Financial instruments designated at fair value through profit or loss1 (9) (6) 10
Total trading-related income (loss) $ 979 $ 946 $ 1,019
By product
Interest rate and credit portfolios $ 601 $ 557 $ 534
Foreign exchange portfolios 385 368 374
Equity and other portfolios 2 27 101
Financial instruments designated at fair value through profit or loss1 (9) (6) 10
Total trading-related income (loss) $ 979 $ 946 $ 1,019
1 Excludes amounts related to securities designated at fair value through profit
or loss that are not managed within a trading portfolio, but which have been
combined with derivatives to form economic hedging relationships.
1 Certain comparative amounts have been reclassified to conform with the
presentation adopted in the current year.
NON-INTEREST INCOME
Non-interest income for the year on a reported basis was
$12,377 million, an increase of $1,192 million, or 11%, compared
with last year. Adjusted non-interest income for the year was
$12,097 million, an increase of $983 million, or 9%, compared
with last year. The increase in adjusted non-interest income was
primarily driven by increases in the Canadian Retail, U.S. Retail, and
Corporate segments. Canadian Retail non-interest income increased
primarily due to wealth asset growth, higher volume-related fee
growth, the inclusion of Aeroplan, and higher insurance revenue.
U.S. Retail non-interest income increased primarily due to the full year
inclusions of Target and Epoch, and the impact of foreign currency
translation, partially offset by lower gains on sales of securities and
debt securities classified as loans. Corporate segment non-interest
income increased primarily due to the gains on sales of TD Ameritrade
shares in the current year.
TRADING-RELATED INCOME
Trading-related income is the total of net interest income on trading
positions, trading income (loss), and income from financial instruments
designated at fair value through profit or loss that are managed within
a trading portfolio. Trading-related income increased by $33 million,
or 3%, compared with last year. The increase was primarily driven
by higher interest rate and credit trading on improved client activity
during the year.
The mix of trading-related income between net interest income
and trading income is largely dependent upon the level of interest
rates, which drives the funding costs of the Bank’s trading portfolios.
Generally, as interest rates rise, net interest income declines and trad-
ing income reported in non-interest income increases. Management
believes that the total trading-related income is the appropriate
measure of trading performance.