TD Bank 2014 Annual Report Download - page 18
Download and view the complete annual report
Please find page 18 of the 2014 TD Bank annual report below. You can navigate through the pages in the report by either clicking on the pages listed below, or by using the keyword search tool below to find specific information within the annual report.-
 1
1 -
2
-
3
-
4
-
5
-
6
-
7
-
 8
8 -
 9
9 -
 10
10 -
 11
11 -
 12
12 -
 13
13 -
 14
14 -
 15
15 -
 16
16 -
 17
17 -
 18
18 -
 19
19 -
 20
20 -
 21
21 -
 22
22 -
 23
23 -
 24
24 -
 25
25 -
 26
26 -
 27
27 -
 28
28 -
29
-
30
-
31
-
32
-
33
-
34
-
35
-
36
-
37
-
38
-
39
-
40
-
41
-
42
-
43
-
44
-
45
-
46
-
47
-
48
-
49
-
50
-
51
-
52
-
53
-
54
-
55
-
56
-
57
-
58
-
59
-
60
-
61
-
62
-
63
-
64
-
65
-
66
-
67
-
68
-
69
-
70
-
71
-
72
-
73
-
74
-
75
-
76
-
77
-
78
-
79
-
80
-
81
-
82
-
83
-
84
-
85
-
86
-
87
-
88
-
89
-
90
-
91
-
92
-
93
-
94
-
95
-
96
-
97
-
98
-
99
-
100
-
101
-
102
-
103
-
104
-
105
-
106
-
107
-
108
-
109
-
110
-
111
-
112
-
113
-
114
-
115
-
116
-
117
-
118
-
119
-
120
-
121
-
122
-
123
-
124
-
125
-
126
-
127
-
128
-
129
-
130
-
131
-
132
-
133
-
134
-
135
-
136
-
137
-
138
-
139
-
140
-
141
-
142
-
143
-
144
-
145
-
146
-
147
-
148
-
149
-
150
-
151
-
152
-
153
-
154
-
155
-
156
-
157
-
158
-
159
-
160
-
161
-
162
-
163
-
164
-
165
-
166
-
167
-
168
-
169
-
170
-
171
-
172
-
173
-
174
-
175
-
176
-
177
-
178
-
179
-
180
-
181
-
182
-
183
-
184
-
185
-
186
-
187
-
188
-
189
-
190
-
191
-
192
-
193
-
194
-
195
-
196
-
197
-
198
-
199
-
200
-
201
-
202
-
203
-
204
-
205
-
206
-
207
-
208
-
209
-
210
-
211
-
212
-
213
-
214
-
215
-
216
-
217
-
218
-
219
-
220
-
221
-
222
-
223
-
224
-
225
-
226
-
227
-
228
 |
 |

TD BANK GROUP ANNUAL REPORT 2014 MANAGEMENT’S DISCUSSION AND ANALYSIS16
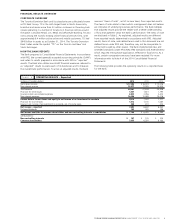
(millions of Canadian dollars) 2014 vs. 2013
2013 vs. 2012
Favourable (unfavourable) due to change in
Favourable (unfavourable) due to change in
Average volume Average rate Net change Average volume Average rate Net change
Interest-earning assets
Interest-bearing deposits with banks
Canada $ (5) $ (1) $ (6) $ (20) $ 2 $ (18)
U.S. 17 (19) (2) 13 (23) (10)
Securities
Trading
Canada 26 (57) (31) 166 (100) 66
U.S. 32 (20) 12 62 28 90
Non-trading
Canada 43 (2) 41 26 22 48
U.S. 199 (213) (14) 14 (301) (287)
Securities purchased under reverse
repurchase agreements
Canada 52 6 58 (16) (3) (19)
U.S. 11 (43) (32) 14 (10) 4
Loans
Mortgages3
Canada 360 (179) 181 436 (187) 249
U.S. 165 (162) 3 219 (180) 39
Consumer instalment and other personal
Canada (62) (157) (219) (106) (446) (552)
U.S. 119 (77) 42 164 (166) (2)
Credit card
Canada 426 (9) 417 55 74 129
U.S. 444 9 453 435 275 710
Business and government3
Canada 43 163 206 370 (238) 132
U.S. 312 (157) 155 185 (207) (22)
International 95 (46) 49 65 (245) (180)
Total interest-earning assets $ 2,277 $ (964) $ 1,313 $ 2,082 $ (1,705) $ 377
Interest-bearing liabilities
Deposits
Personal
Canada $ (44) $ 310 $ 266 $ (85) $ 244 $ 159
U.S. (27) 41 14 (24) 77 53
Banks
Canada – (7) (7) (6) 23 17
U.S. (3) 1 (2) (2) (2) (4)
Business and government4,5
Canada (262) (8) (270) (85) 118 33
U.S. (152) 335 183 (315) 293 (22)
Subordinated notes and debentures 29 6 35 159 6 165
Obligations related to securities sold short and
under repurchase agreements
Canada (29) (34) (63) (34) (6) (40)
U.S. (14) (6) (20) (24) 18 (6)
Securitization liabilities6 159 (9) 150 32 67 99
Other liabilities7,8
Canada (1) (5) (6) 65 102 167
U.S. 2 – 2 2 (2) –
International (68) (17) (85) (23) 73 50
Total interest-bearing liabilities $ (410) $ 607 $ 197 $ (340) $ 1,011 $ 671
Total net interest income on average earning assets $ 1,867 $ (357) $ 1,510 $ 1,742 $ (694) $ 1,048
ANALYSIS OF CHANGE IN NET INTEREST INCOME1,2
TABLE 8
1 Geographic classification of assets and liabilities is based on the domicile of the
booking point of assets and liabilities.
2 Interest income includes loan fees earned by the Bank, which are recognized in net
interest income over the life of the loan through the effective interest rate method.
3 Includes trading loans that the Bank intends to sell immediately or in the near
term with a fair value of $37 million (2013 – $24 million, 2012 – $25 million) and
amortized cost of $36 million (2013 – $24 million, 2012 – $25 million), and loans
designated at fair value through profit or loss of $5 million (2013 – $9 million,
2012 – $13 million) and amortized cost of nil (2013 – nil, 2012 – nil).
4 Includes trading deposits with a fair value of $59 billion (2013 – $51 billion,
2012 – $39 billion).
5 Includes marketing fees incurred on the TD Ameritrade IDA of $895 million
(2013 – $821 million, 2012 – $834 million).
6 Includes securitization liabilities designated at fair value through profit or loss
of $11 billion (2013 – $22 billion, 2012 – $25 billion) and related amortized cost
of $11 billion (2013 – $22 billion, 2012 – $25 billion). Also includes securitization
liabilities at amortized cost of $25 billion (2013 – $25 billion, 2012 – $25 billion).
7 Other liabilities includes asset-backed commercial paper and term notes with an
amortized cost of $5 billion (2013 – $5 billion, 2012 – $5 billion).
8 Certain comparative amounts have been reclassified to conform with the
presentation adopted in the current year.
The following table presents an analysis of the change in net interest
income of volume and interest rate changes. In this analysis, changes
due to volume/interest rate variance have been allocated to average
interest rate.