TD Bank 2014 Annual Report Download - page 20
Download and view the complete annual report
Please find page 20 of the 2014 TD Bank annual report below. You can navigate through the pages in the report by either clicking on the pages listed below, or by using the keyword search tool below to find specific information within the annual report.-
 1
1 -
2
-
3
-
4
-
5
-
6
-
7
-
8
-
9
-
 10
10 -
 11
11 -
 12
12 -
 13
13 -
 14
14 -
 15
15 -
 16
16 -
 17
17 -
 18
18 -
 19
19 -
 20
20 -
 21
21 -
 22
22 -
 23
23 -
 24
24 -
 25
25 -
 26
26 -
 27
27 -
 28
28 -
 29
29 -
 30
30 -
31
-
32
-
33
-
34
-
35
-
36
-
37
-
38
-
39
-
40
-
41
-
42
-
43
-
44
-
45
-
46
-
47
-
48
-
49
-
50
-
51
-
52
-
53
-
54
-
55
-
56
-
57
-
58
-
59
-
60
-
61
-
62
-
63
-
64
-
65
-
66
-
67
-
68
-
69
-
70
-
71
-
72
-
73
-
74
-
75
-
76
-
77
-
78
-
79
-
80
-
81
-
82
-
83
-
84
-
85
-
86
-
87
-
88
-
89
-
90
-
91
-
92
-
93
-
94
-
95
-
96
-
97
-
98
-
99
-
100
-
101
-
102
-
103
-
104
-
105
-
106
-
107
-
108
-
109
-
110
-
111
-
112
-
113
-
114
-
115
-
116
-
117
-
118
-
119
-
120
-
121
-
122
-
123
-
124
-
125
-
126
-
127
-
128
-
129
-
130
-
131
-
132
-
133
-
134
-
135
-
136
-
137
-
138
-
139
-
140
-
141
-
142
-
143
-
144
-
145
-
146
-
147
-
148
-
149
-
150
-
151
-
152
-
153
-
154
-
155
-
156
-
157
-
158
-
159
-
160
-
161
-
162
-
163
-
164
-
165
-
166
-
167
-
168
-
169
-
170
-
171
-
172
-
173
-
174
-
175
-
176
-
177
-
178
-
179
-
180
-
181
-
182
-
183
-
184
-
185
-
186
-
187
-
188
-
189
-
190
-
191
-
192
-
193
-
194
-
195
-
196
-
197
-
198
-
199
-
200
-
201
-
202
-
203
-
204
-
205
-
206
-
207
-
208
-
209
-
210
-
211
-
212
-
213
-
214
-
215
-
216
-
217
-
218
-
219
-
220
-
221
-
222
-
223
-
224
-
225
-
226
-
227
-
228
 |
 |

TD BANK GROUP ANNUAL REPORT 2014 MANAGEMENT’S DISCUSSION AND ANALYSIS18
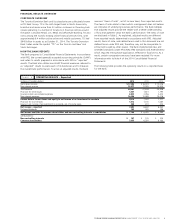
NON-INTEREST EXPENSES
(millions of Canadian dollars)
12 13 14
$18,000
15,000
0
6,000
12,000
9,000
3,000
AdjustedReported
60%
50
40
30
20
10
0
EFFICIENCY RATIO
(percent)
AdjustedReported
12 13 14
EFFICIENCY RATIO
The efficiency ratio measures operating efficiency and is calculated
by taking the non-interest expenses as a percentage of total revenue.
A lower ratio indicates a more efficient business operation.
The reported efficiency ratio was 55.1% compared with 55.3% last
year. The adjusted efficiency ratio worsened to 53.4%, compared with
52.9% last year. Expenses grew faster than revenue primarily due to
higher investments to support business growth and higher enterprise
and regulatory projects, and productivity initiatives.
FINANCIAL RESULTS OVERVIEW
Expenses
AT A GLANCE OVERVIEW
• Reported non-interest expenses were $16,496 million, an
increase of $1,427 million, or 9%, compared with last year.
• Adjusted non-interest expenses were $15,863 million, an
increase of $1,473 million, or 10%, compared with last year.
• Reported efficiency ratio improved to 55.1% compared with
55.3% last year.
• Adjusted efficiency ratio worsened to 53.4% compared with
52.9% last year.
NON-INTEREST EXPENSES
Reported non-interest expenses for the year were $16,496 million,
an increase of $1,427 million, or 9%, compared with last year.
Adjusted non-interest expenses were $15,863 million, an increase
of $1,473 million, or 10%, compared with last year. The increase
in adjusted non-interest expenses was driven by increases in the
U.S. Retail, Canadian Retail, and Corporate segments. U.S. Retail
non-interest expenses increased primarily due to the full year inclusion
of Target, investments to support business growth, and the impact
of foreign currency translation, partially offset by productivity gains.
Canadian Retail non-interest expenses increased primarily due
to higher employee-related costs including higher revenue-based
variable expenses in the wealth business, the inclusion of Aeroplan,
investments to support business growth, and volume growth, partially
offset by productivity gains. Corporate segment non-interest expenses
increased primarily due to ongoing investment in enterprise and
regulatory projects, and productivity initiatives.