TD Bank 2014 Annual Report Download - page 11
Download and view the complete annual report
Please find page 11 of the 2014 TD Bank annual report below. You can navigate through the pages in the report by either clicking on the pages listed below, or by using the keyword search tool below to find specific information within the annual report.-
 1
1 -
 2
2 -
 3
3 -
 4
4 -
 5
5 -
 6
6 -
 7
7 -
 8
8 -
 9
9 -
 10
10 -
 11
11 -
 12
12 -
 13
13 -
 14
14 -
 15
15 -
 16
16 -
 17
17 -
 18
18 -
 19
19 -
 20
20 -
 21
21 -
 22
22 -
23
-
24
-
25
-
26
-
27
-
28
-
29
-
30
-
31
-
32
-
33
-
34
-
35
-
36
-
37
-
38
-
39
-
40
-
41
-
42
-
43
-
44
-
45
-
46
-
47
-
48
-
49
-
50
-
51
-
52
-
53
-
54
-
55
-
56
-
57
-
58
-
59
-
60
-
61
-
62
-
63
-
64
-
65
-
66
-
67
-
68
-
69
-
70
-
71
-
72
-
73
-
74
-
75
-
76
-
77
-
78
-
79
-
80
-
81
-
82
-
83
-
84
-
85
-
86
-
87
-
88
-
89
-
90
-
91
-
92
-
93
-
94
-
95
-
96
-
97
-
98
-
99
-
100
-
101
-
102
-
103
-
104
-
105
-
106
-
107
-
108
-
109
-
110
-
111
-
112
-
113
-
114
-
115
-
116
-
117
-
118
-
119
-
120
-
121
-
122
-
123
-
124
-
125
-
126
-
127
-
128
-
129
-
130
-
131
-
132
-
133
-
134
-
135
-
136
-
137
-
138
-
139
-
140
-
141
-
142
-
143
-
144
-
145
-
146
-
147
-
148
-
149
-
150
-
151
-
152
-
153
-
154
-
155
-
156
-
157
-
158
-
159
-
160
-
161
-
162
-
163
-
164
-
165
-
166
-
167
-
168
-
169
-
170
-
171
-
172
-
173
-
174
-
175
-
176
-
177
-
178
-
179
-
180
-
181
-
182
-
183
-
184
-
185
-
186
-
187
-
188
-
189
-
190
-
191
-
192
-
193
-
194
-
195
-
196
-
197
-
198
-
199
-
200
-
201
-
202
-
203
-
204
-
205
-
206
-
207
-
208
-
209
-
210
-
211
-
212
-
213
-
214
-
215
-
216
-
217
-
218
-
219
-
220
-
221
-
222
-
223
-
224
-
225
-
226
-
227
-
228
 |
 |

TD BANK GROUP ANNUAL REPORT 2014 MANAGEMENT’S DISCUSSION AND ANALYSIS 9
removes “items of note”, net of income taxes, from reported results.
The items of note relate to items which management does not believe
are indicative of underlying business performance. The Bank believes
that adjusted results provide the reader with a better understanding
of how management views the Bank’s performance. The items of note
are disclosed in Table 2. As explained, adjusted results are different
from reported results determined in accordance with IFRS. Adjusted
results, items of note, and related terms used in this document are not
defined terms under IFRS and, therefore, may not be comparable to
similar terms used by other issuers. The Bank implemented new and
amended standards under IFRS (New IFRS Standards and Amendments)
which required retrospective application, effective in fiscal 2014. As a
result, certain comparative amounts have been restated. For more
information refer to Note 4 of the 2014 Consolidated Financial
Statements.
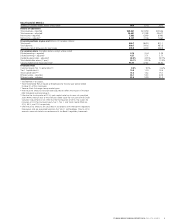
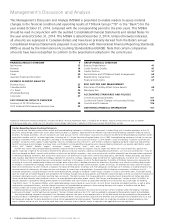
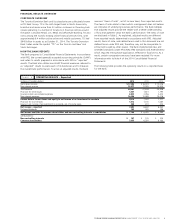
The following table provides the operating results on a reported basis
for the Bank.
FINANCIAL RESULTS OVERVIEW
CORPORATE OVERVIEW
The Toronto-Dominion Bank and its subsidiaries are collectively known
as TD Bank Group. TD is the sixth largest bank in North America by
branches and serves more than 23 million customers in three key busi-
nesses operating in a number of locations in financial centres around
the globe: Canadian Retail, U.S. Retail and Wholesale Banking. TD also
ranks among the world’s leading online financial services firms, with
approximately 9.4 million active online and mobile customers. TD had
$945 billion in assets as at October 31, 2014. The Toronto-Dominion
Bank trades under the symbol “TD” on the Toronto and New York
Stock Exchanges.
HOW THE BANK REPORTS
The Bank prepares its Consolidated Financial Statements in accordance
with IFRS, the current generally accepted accounting principles (GAAP),
and refers to results prepared in accordance with IFRS as “reported”
results. The Bank also utilizes non-GAAP financial measures referred to
as “adjusted” results to assess each of its businesses and to measure
the overall Bank performance. To arrive at adjusted results, the Bank
OPERATING RESULTS – Reported
TABLE 1
(millions of Canadian dollars) 2014 2013 2012
Net interest income $ 17,584 $ 16,074 $ 15,026
Non-interest income 12,377 11,185 10,520
Total revenue 29,961 27,259 25,546
Provision for credit losses 1,557 1,631 1,795
Insurance claims and related expenses 2,833 3,056 2,424
Non-interest expenses 16,496 15,069 14,016
Income before income taxes and equity in net income of an investment in associate 9,075 7,503 7,311
Provision for income taxes 1,512 1,135 1,085
Equity in net income of an investment in associate, net of income taxes 320 272 234
Net income – reported 7,883 6,640 6,460
Preferred dividends 143 185 196
Net income available to common shareholders and non-controlling interests in subsidiaries $ 7,740 $ 6,455 $ 6,264
Attributable to:
Non-controlling interests $ 107 $ 105 $ 104
Common shareholders 7,633 6,350 6,160