TD Bank 2014 Annual Report Download - page 3
Download and view the complete annual report
Please find page 3 of the 2014 TD Bank annual report below. You can navigate through the pages in the report by either clicking on the pages listed below, or by using the keyword search tool below to find specific information within the annual report.-
 1
1 -
 2
2 -
 3
3 -
 4
4 -
 5
5 -
 6
6 -
 7
7 -
 8
8 -
 9
9 -
 10
10 -
 11
11 -
 12
12 -
 13
13 -
 14
14 -
15
-
16
-
17
-
18
-
19
-
20
-
21
-
22
-
23
-
24
-
25
-
26
-
27
-
28
-
29
-
30
-
31
-
32
-
33
-
34
-
35
-
36
-
37
-
38
-
39
-
40
-
41
-
42
-
43
-
44
-
45
-
46
-
47
-
48
-
49
-
50
-
51
-
52
-
53
-
54
-
55
-
56
-
57
-
58
-
59
-
60
-
61
-
62
-
63
-
64
-
65
-
66
-
67
-
68
-
69
-
70
-
71
-
72
-
73
-
74
-
75
-
76
-
77
-
78
-
79
-
80
-
81
-
82
-
83
-
84
-
85
-
86
-
87
-
88
-
89
-
90
-
91
-
92
-
93
-
94
-
95
-
96
-
97
-
98
-
99
-
100
-
101
-
102
-
103
-
104
-
105
-
106
-
107
-
108
-
109
-
110
-
111
-
112
-
113
-
114
-
115
-
116
-
117
-
118
-
119
-
120
-
121
-
122
-
123
-
124
-
125
-
126
-
127
-
128
-
129
-
130
-
131
-
132
-
133
-
134
-
135
-
136
-
137
-
138
-
139
-
140
-
141
-
142
-
143
-
144
-
145
-
146
-
147
-
148
-
149
-
150
-
151
-
152
-
153
-
154
-
155
-
156
-
157
-
158
-
159
-
160
-
161
-
162
-
163
-
164
-
165
-
166
-
167
-
168
-
169
-
170
-
171
-
172
-
173
-
174
-
175
-
176
-
177
-
178
-
179
-
180
-
181
-
182
-
183
-
184
-
185
-
186
-
187
-
188
-
189
-
190
-
191
-
192
-
193
-
194
-
195
-
196
-
197
-
198
-
199
-
200
-
201
-
202
-
203
-
204
-
205
-
206
-
207
-
208
-
209
-
210
-
211
-
212
-
213
-
214
-
215
-
216
-
217
-
218
-
219
-
220
-
221
-
222
-
223
-
224
-
225
-
226
-
227
-
228
 |
 |

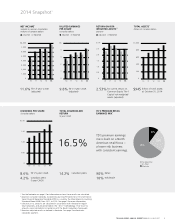
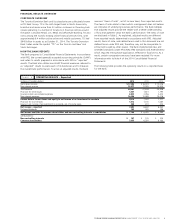
TD BANK GROUP ANNUAL REPORT 2014 2014 SNAPSHOT 1
2014 Snapshot1
10 11 12 13 14
$5
4
3
2
1
0
DILUTED EARNINGS
PER SHARE2
(Canadian dollars)
Adjusted Reported
10 11 12 13 14
0
$8,000
7,000
6,000
5,000
4,000
3,000
2,000
1,000
NET INCOME2
available to common shareholders
(millions of Canadian dollars)
Adjusted Reported
10 11 12 13 14
0.50
1.50
$2.00
1.00
0
DIVIDENDS PER SHARE
(Canadian dollars)
TOTAL SHAREHOLDER
RETURN
(5-year CAGR)
TD’S PREMIUM RETAIL
EARNINGS MIX4
10 11 12 13 14
3.0%
1.0
0.5
2.5
2.0
1.5
0
RETURN ON RISK-
WEIGHTED ASSETS2,3
(percent)
Adjusted Reported
10 11 12 13 14
400
$1,000
800
600
200
0
TOTAL ASSETS2
(billions of Canadian dollars)
11.6% TD’s 5-year CAGR
(adjusted)
8.6% TD’s 5-year CAGR
4.2% Canadian peers
5-year CAGR
14.2% Canadian peers 90% Retail
10% Wholesale
9.8% TD’s 5-year CAGR
(adjusted) 2.53% TD’s 2014 return on
Common Equity Tier 1
Capital risk-weighted
assets (adjusted)
$945 billion of total assets
at October 31, 2014
16.5%
TD’s premium earnings
mix is built on a North
American retail focus –
a lower-risk business
with consistent earnings.
65%
25%
10%
Canadian Retail
U.S. Retail
Wholesale
1
See the footnotes on page 2 for information on how these results are calculated.
2
Based on Canadian Generally Accepted Accounting Principles for 2010 and Interna-
tional Financial Reporting Standards (IFRS) as issued by the International Accounting
Standards Board (IASB) from 2011 to 2014. See page 2 for more information.
3
Effective 2013, amounts are calculated in accordance with the Basel III regula-
tory framework, and are presented on the “all-in” methodology. Prior to 2013,
amounts were calculated in accordance with the Basel II regulatory framework.
4
Based on adjusted results as defined in footnote 1 on page 2 and excludes
Corporate segment.