TD Bank 2014 Annual Report Download - page 14
Download and view the complete annual report
Please find page 14 of the 2014 TD Bank annual report below. You can navigate through the pages in the report by either clicking on the pages listed below, or by using the keyword search tool below to find specific information within the annual report.-
 1
1 -
2
-
3
-
 4
4 -
 5
5 -
 6
6 -
 7
7 -
 8
8 -
 9
9 -
 10
10 -
 11
11 -
 12
12 -
 13
13 -
 14
14 -
 15
15 -
 16
16 -
 17
17 -
 18
18 -
 19
19 -
 20
20 -
 21
21 -
 22
22 -
 23
23 -
 24
24 -
25
-
26
-
27
-
28
-
29
-
30
-
31
-
32
-
33
-
34
-
35
-
36
-
37
-
38
-
39
-
40
-
41
-
42
-
43
-
44
-
45
-
46
-
47
-
48
-
49
-
50
-
51
-
52
-
53
-
54
-
55
-
56
-
57
-
58
-
59
-
60
-
61
-
62
-
63
-
64
-
65
-
66
-
67
-
68
-
69
-
70
-
71
-
72
-
73
-
74
-
75
-
76
-
77
-
78
-
79
-
80
-
81
-
82
-
83
-
84
-
85
-
86
-
87
-
88
-
89
-
90
-
91
-
92
-
93
-
94
-
95
-
96
-
97
-
98
-
99
-
100
-
101
-
102
-
103
-
104
-
105
-
106
-
107
-
108
-
109
-
110
-
111
-
112
-
113
-
114
-
115
-
116
-
117
-
118
-
119
-
120
-
121
-
122
-
123
-
124
-
125
-
126
-
127
-
128
-
129
-
130
-
131
-
132
-
133
-
134
-
135
-
136
-
137
-
138
-
139
-
140
-
141
-
142
-
143
-
144
-
145
-
146
-
147
-
148
-
149
-
150
-
151
-
152
-
153
-
154
-
155
-
156
-
157
-
158
-
159
-
160
-
161
-
162
-
163
-
164
-
165
-
166
-
167
-
168
-
169
-
170
-
171
-
172
-
173
-
174
-
175
-
176
-
177
-
178
-
179
-
180
-
181
-
182
-
183
-
184
-
185
-
186
-
187
-
188
-
189
-
190
-
191
-
192
-
193
-
194
-
195
-
196
-
197
-
198
-
199
-
200
-
201
-
202
-
203
-
204
-
205
-
206
-
207
-
208
-
209
-
210
-
211
-
212
-
213
-
214
-
215
-
216
-
217
-
218
-
219
-
220
-
221
-
222
-
223
-
224
-
225
-
226
-
227
-
228
 |
 |

TD BANK GROUP ANNUAL REPORT 2014 MANAGEMENT’S DISCUSSION AND ANALYSIS12
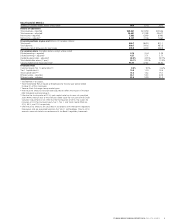
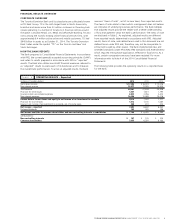
RETURN ON COMMON EQUITY
TABLE 5
(millions of Canadian dollars, except as noted) 2014 2013 2012
Average common equity $ 49,495 $ 44,791 $ 41,102
Net income available to common shareholders – reported 7,633 6,350 6,160
Items of note impacting income, net of income taxes1 244 496 604
Net income available to common shareholders – adjusted 7,877 6,846 6,764
Return on common equity – adjusted 15.9% 15.3% 16.5%
1 For explanations of items of note, see the “Non-GAAP Financial Measures –
Reconciliation of Adjusted to Reported Net Income” table in the “Financial
Results Overview” section of this document.
RETURN ON COMMON EQUITY
The Bank’s methodology for allocating capital to its business segments
is aligned with the common equity capital requirements under Basel III.
Beginning November 1, 2013, capital allocated to the business segments
is based on 8% Common Equity Tier 1 (CET1) Capital which includes
an additional charge of 1% of risk-weighted assets (RWA) to account
for the Office of the Superintendent of Financial Institutions Canada
(OSFI) common equity capital surcharge for Domestic Systemically
Important Banks (D-SIBs), resulting in a CET1 Capital ratio minimum
requirement of 8% effective January 1, 2016. The return measures for
business segments reflect a return on common equity methodology.
Adjusted return on common equity (ROE) is adjusted net income
available to common shareholders as a percentage of average
common equity.
Adjusted ROE is a non-GAAP financial measure as it is not a defined
term under IFRS. Readers are cautioned that earnings and other
measures adjusted to a basis other than IFRS do not have standardized
meanings under IFRS and, therefore, may not be comparable to similar
terms used by other issuers.
SIGNIFICANT EVENTS IN 2014
Acquisition of certain CIBC Aeroplan Credit Card Accounts
On December 27, 2013, the Bank, Aimia Inc. (Aimia), and the Canadian
Imperial Bank of Commerce (CIBC) closed a transaction under which
the Bank acquired approximately 50% of CIBC’s existing Aeroplan
credit card portfolio, which primarily included accounts held by custom-
ers who did not have an existing retail banking relationship with CIBC.
The Bank accounted for the purchase as an asset acquisition. The results
of the acquisition have been recorded in the Canadian Retail segment.
The Bank acquired approximately 540,000 cardholder accounts with
an outstanding balance of $3.3 billion at a price of par plus $50 million
less certain adjustments for total cash consideration of $3.3 billion.
At the date of acquisition, the fair value of credit card receivables
acquired was $3.2 billion and the fair value of an intangible asset
for the purchased credit card relationships was $146 million.
In connection with the purchase agreement, the Bank agreed to pay
CIBC a further $127 million under a commercial subsidy agreement.
This payment was recognized as a non-interest expense in 2014.
Disposal of TD Waterhouse Institutional Services
On November 12, 2013, TD Waterhouse Canada Inc., a subsidiary of
the Bank, completed the sale of the Bank’s institutional services busi-
ness, known as TD Waterhouse Institutional Services, to a subsidiary
of National Bank of Canada. The transaction price was $250 million
in cash, subject to certain price adjustment mechanisms. A pre-tax
gain of $231 million was recorded in the Corporate segment in other
income in the first quarter of 2014. An additional pre-tax gain of
$13 million was recorded in the Corporate segment subsequently,
upon the settlement of price adjustment mechanisms.
AMORTIZATION OF INTANGIBLES, NET OF INCOME TAXES1
TABLE 4
(millions of Canadian dollars) 2014 2013 2012
TD Bank, N.A. $ 115 $ 117 $ 122
TD Ameritrade (included in equity in net income of an investment in associate) 53 54 57
MBNA Canada 37 36 33
Aeroplan 14 – –
Other 27 25 26
246 232 238
Software 236 176 141
Amortization of intangibles, net of income taxes $ 482 $ 408 $ 379
1 Amortization of intangibles, with the exception of software, are included as items
of note. For explanation of items of note, see the “Non-GAAP Financial Measures –
Reconciliation of Adjusted to Reported Net Income” table in the “Financial Results
Overview” section of this document.