TCF Bank 2003 Annual Report Download - page 76
Download and view the complete annual report
Please find page 76 of the 2003 TCF Bank annual report below. You can navigate through the pages in the report by either clicking on the pages listed below, or by using the keyword search tool below to find specific information within the annual report.-
 1
1 -
2
-
3
-
4
-
5
-
6
-
7
-
8
-
9
-
10
-
11
-
12
-
13
-
14
-
15
-
16
-
17
-
18
-
19
-
20
-
21
-
22
-
23
-
24
-
25
-
26
-
27
-
28
-
29
-
30
-
31
-
32
-
33
-
34
-
35
-
36
-
37
-
38
-
39
-
40
-
41
-
42
-
43
-
44
-
45
-
46
-
47
-
48
-
49
-
50
-
51
-
52
-
53
-
54
-
55
-
56
-
57
-
58
-
59
-
60
-
61
-
62
-
63
-
64
-
65
-
 66
66 -
 67
67 -
 68
68 -
 69
69 -
 70
70 -
 71
71 -
 72
72 -
 73
73 -
 74
74 -
 75
75 -
 76
76 -
 77
77 -
 78
78 -
 79
79 -
 80
80 -
 81
81 -
 82
82 -
 83
83 -
 84
84 -
 85
85 -
 86
86
 |
 |

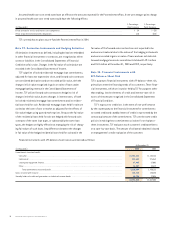
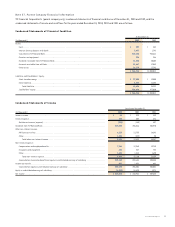
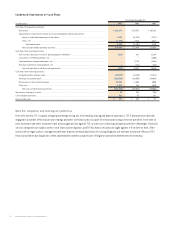
74 TCF Financial Corporation and Subsidiaries
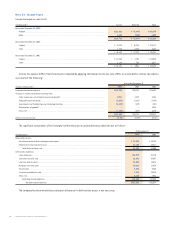
The following table sets forth certain information about the reported profit or loss and assets of each of TCF’s reportable segments,
including a reconciliation of TCF’s consolidated totals. The results of TCF’s parent company and corporate functions comprise the “other”
category in the table below.
Leasing and Eliminations
Equipment Mortgage and
(In thousands) Banking Finance Banking Other Reclassifications Consolidated
At or For the Year Ended December 31, 2003:
Revenues from external customers:
Interest income . . . . . . . . . . . . . . . . . . . . . $ 545,764 $ 81,912 $ 13,843 $ – $ – $ 641,519
Non-interest income . . . . . . . . . . . . . . . . . 355,387 51,088 12,719 85 – 419,279
Total . . . . . . . . . . . . . . . . . . . . . . . . . . $ 901,151 $ 133,000 $ 26,562 $ 85 $ – $ 1,060,798
Net interest income . . . . . . . . . . . . . . . . . . . . . $ 414,288 $ 45,358 $ 21,357 $ (199) $ 341 $ 481,145
Provision for credit losses . . . . . . . . . . . . . . . . . 4,361 8,171 – – – 12,532
Non-interest income . . . . . . . . . . . . . . . . . . . . . 355,387 51,088 13,102 88,760 (89,058) 419,279
Other non-interest expense . . . . . . . . . . . . . . . 487,808 41,977 29,963 89,078 (88,717) 560,109
Income tax expense (benefit) . . . . . . . . . . . . . 96,496 17,031 1,590 (3,212) – 111,905
Net income . . . . . . . . . . . . . . . . . . . . . . . . . $ 180,010 $ 29,267 $ 2,906 $ 2,695 $ – $ 215,878
Total assets . . . . . . . . . . . . . . . . . . . . . . . . . . . $10,935,853 $ 1,216,854 $ 173,867 $ 105,634 $(1,113,193) $11,319,015
At or For the Year Ended December 31, 2002:
Revenues from external customers:
Interest income . . . . . . . . . . . . . . . . . . . . . $ 632,803 $ 85,447 $ 15,112 $ 1 $ – $ 733,363
Non-interest income . . . . . . . . . . . . . . . . . 359,896 51,628 6,979 1,259 – 419,762
Total . . . . . . . . . . . . . . . . . . . . . . . . . . $ 992,699 $ 137,075 $ 22,091 $ 1,260 $ – $ 1,153,125
Net interest income . . . . . . . . . . . . . . . . . . . . . $ 435,883 $ 41,374 $ 20,676 $ (45) $ 1,337 $ 499,225
Provision for credit losses . . . . . . . . . . . . . . . . 12,778 9,228 – – – 22,006
Non-interest income . . . . . . . . . . . . . . . . . . . . 359,896 51,806 8,316 95,272 (95,528) 419,762
Other non-interest expense . . . . . . . . . . . . . . . 471,739 40,983 24,796 95,961 (94,191) 539,288
Income tax expense (benefit) . . . . . . . . . . . . . 110,158 15,497 1,511 (2,404) – 124,762
Net income . . . . . . . . . . . . . . . . . . . . . . . . . $ 201,104 $ 27,472 $ 2,685 $ 1,670 $ – $ 232,931
Total assets . . . . . . . . . . . . . . . . . . . . . . . . . . . $ 11,806,012 $ 1,100,744 $ 447,840 $ 75,270 $ (1,227,797) $ 12,202,069
At or For the Year Ended December 31, 2001:
Revenues from external customers:
Interest income . . . . . . . . . . . . . . . . . . . . . $ 722,722 $ 89,131 $ 14,334 $ 422 $ – $ 826,609
Non-interest income . . . . . . . . . . . . . . . . . 313,501 45,730 12,042 213 – 371,486
Total . . . . . . . . . . . . . . . . . . . . . . . . . . $ 1,036,223 $ 134,861 $ 26,376 $ 635 $ – $ 1,198,095
Net interest income . . . . . . . . . . . . . . . . . . . . . $ 423,043 $ 39,429 $ 14,919 $ 433 $ 3,398 $ 481,222
Provision for credit losses . . . . . . . . . . . . . . . . 7,359 13,519 – – – 20,878
Non-interest income . . . . . . . . . . . . . . . . . . . . 313,501 45,730 15,439 96,829 (100,013) 371,486
Amortization of goodwill . . . . . . . . . . . . . . . . . 7,350 427 – – – 7,777
Other non-interest expense . . . . . . . . . . . . . . . 432,298 38,369 20,893 99,274 (96,615) 494,219
Income tax expense (benefit) . . . . . . . . . . . . . 109,063 12,410 3,577 (2,538) – 122,512
Net income . . . . . . . . . . . . . . . . . . . . . . . . . $ 180,474 $ 20,434 $ 5,888 $ 526 $ – $ 207,322
Total assets . . . . . . . . . . . . . . . . . . . . . . . . . . . $ 10,985,850 $ 988,387 $ 374,263 $ 74,673 $ (1,064,458) $ 11,358,715
Note 26. Business Segments
Banking, leasing and equipment finance, and mortgage banking
have been identified as reportable operating segments. Banking
includes the following operating units that provide financial services
to customers: deposits and investment products, commercial lend-
ing, consumer lending, residential lending and treasury services.
Management of TCF’s banking area is organized by state. The sepa-
rate state operations have been aggregated for purposes of segment
disclosures. Leasing and equipment finance provides a broad range
of comprehensive leasing and equipment finance products address-
ing the financing needs of diverse companies. Mortgage banking
activities include the origination and purchase of residential
mortgage loans primarily for sale to third parties, generally with
servicing retained. In addition, TCF operates a bank holding company
(“parent company”) and has corporate functions that provide data
processing, bank operations and other professional services to the
operating segments.
TCF evaluates performance and allocates resources based on
the segments’ net income. The business segments follow generally
accepted accounting principles as described in the Summary of
Significant Accounting Policies. TCF generally accounts for inter-
segment sales and transfers at cost.