TCF Bank 2003 Annual Report Download - page 59
Download and view the complete annual report
Please find page 59 of the 2003 TCF Bank annual report below. You can navigate through the pages in the report by either clicking on the pages listed below, or by using the keyword search tool below to find specific information within the annual report.-
 1
1 -
2
-
3
-
4
-
5
-
6
-
7
-
8
-
9
-
10
-
11
-
12
-
13
-
14
-
15
-
16
-
17
-
18
-
19
-
20
-
21
-
22
-
23
-
24
-
25
-
26
-
27
-
28
-
29
-
30
-
31
-
32
-
33
-
34
-
35
-
36
-
37
-
38
-
39
-
40
-
41
-
42
-
43
-
44
-
45
-
46
-
47
-
48
-
 49
49 -
 50
50 -
 51
51 -
 52
52 -
 53
53 -
 54
54 -
 55
55 -
 56
56 -
 57
57 -
 58
58 -
 59
59 -
 60
60 -
 61
61 -
 62
62 -
 63
63 -
 64
64 -
 65
65 -
 66
66 -
 67
67 -
 68
68 -
 69
69 -
70
-
71
-
72
-
73
-
74
-
75
-
76
-
77
-
78
-
79
-
80
-
81
-
82
-
83
-
84
-
85
-
86
 |
 |

2003 Annual Report 57
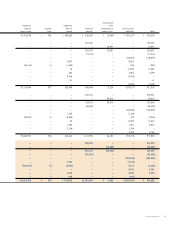
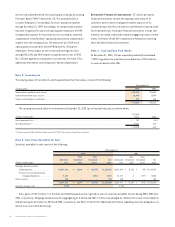
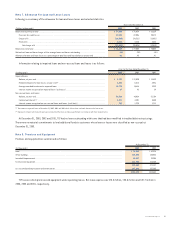
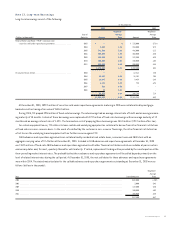
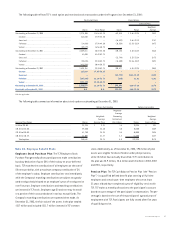
The following table shows the securities available for sale portfolio’s gross unrealized losses and fair value, aggregated by investment
category and length of time that individual securities have been in a continuous unrealized loss position, at December 31, 2003. TCF has reviewed
these securities and has concluded that the unrealized losses are temporary and no permanent impairment has occurred at December 31, 2003.
Less than 12 months 12 months or more Total
Unrealized Unrealized Unrealized
(In thousands) Fair Value Losses Fair Value Losses Fair Value Losses
Mortgage-backed securities:
Federal agencies . . . . . . . . . . . . . . . . . . . . $716,264 $ (4,662) $ 1,477 $ (15) $717,741 $ (4,677)
Private issuer and collateralized
mortgage obligations . . . . . . . . . . . . . – – 8,113 (201) 8,113 (201)
Total temporarily impaired securities . . . . $716,264 $ (4,662) $ 9,590 $ (216) $725,854 $ (4,878)
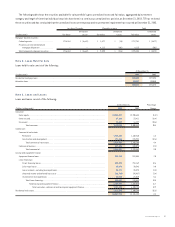
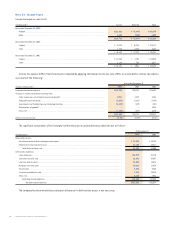
Note 5. Loans Held for Sale
Loans held for sale consist of the following:
At December 31,
(In thousands) 2003 2002
Residential mortgage loans . . . . . . . . . . . . . . . . . . . . . . . . . . . . . . . . . . . . . . . . . . . . . . . . . . . . . . . . . . . . . . . . . . . . . . . . . . . . . . . . . . . . . $101,035 $277,395
Education loans . . . . . . . . . . . . . . . . . . . . . . . . . . . . . . . . . . . . . . . . . . . . . . . . . . . . . . . . . . . . . . . . . . . . . . . . . . . . . . . . . . . . . . . . . . . . . . 234,337 199,080
$335,372 $476,475
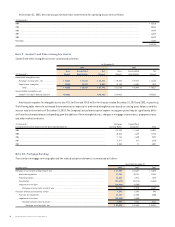
Note 6. Loans and Leases
Loans and leases consist of the following:
At December 31, Percentage
(Dollars in thousands) 2003 2002 Change
Consumer:
Home equity . . . . . . . . . . . . . . . . . . . . . . . . . . . . . . . . . . . . . . . . . . . . . . . . . . . . . . . . . . . . . . . . . . . . . . . . . . . . . . . . . $3,588,027 $2,955,644 21.4%
Other secured . . . . . . . . . . . . . . . . . . . . . . . . . . . . . . . . . . . . . . . . . . . . . . . . . . . . . . . . . . . . . . . . . . . . . . . . . . . . . . . . 27,265 33,411 (18.4)
Unsecured . . . . . . . . . . . . . . . . . . . . . . . . . . . . . . . . . . . . . . . . . . . . . . . . . . . . . . . . . . . . . . . . . . . . . . . . . . . 15,049 16,827 (10.6)
Total consumer . . . . . . . . . . . . . . . . . . . . . . . . . . . . . . . . . . . . . . . . . . . . . . . . . . . . . . . . . . . . . . . . . . 3,630,341 3,005,882 20.8
Commercial:
Commercial real estate:
Permanent . . . . . . . . . . . . . . . . . . . . . . . . . . . . . . . . . . . . . . . . . . . . . . . . . . . . . . . . . . . . . . . . . . . . . . . . . . 1,745,435 1,639,860 6.4
Construction and development . . . . . . . . . . . . . . . . . . . . . . . . . . . . . . . . . . . . . . . . . . . . . . . . . . . . . . . . 171,266 195,928 (12.6)
Total commercial real estate . . . . . . . . . . . . . . . . . . . . . . . . . . . . . . . . . . . . . . . . . . . . . . . . . . . . . . 1,916,701 1,835,788 4.4
Commercial business . . . . . . . . . . . . . . . . . . . . . . . . . . . . . . . . . . . . . . . . . . . . . . . . . . . . . . . . . . . . . . . . . . . 427,696 440,074 (2.8)
Total commercial . . . . . . . . . . . . . . . . . . . . . . . . . . . . . . . . . . . . . . . . . . . . . . . . . . . . . . . . . . . . . . . 2,344,397 2,275,862 3.0
Leasing and equipment finance:
Equipment finance loans . . . . . . . . . . . . . . . . . . . . . . . . . . . . . . . . . . . . . . . . . . . . . . . . . . . . . . . . . . . . . . . . 309,740 289,558 7.0
Lease financings:
Direct financing leases . . . . . . . . . . . . . . . . . . . . . . . . . . . . . . . . . . . . . . . . . . . . . . . . . . . . . . . . . . . . . . 853,395 758,169 12.6
Sales-type leases . . . . . . . . . . . . . . . . . . . . . . . . . . . . . . . . . . . . . . . . . . . . . . . . . . . . . . . . . . . . . . . . . . 33,073 30,346 9.0
Lease residuals, excluding leveraged leases . . . . . . . . . . . . . . . . . . . . . . . . . . . . . . . . . . . . . . . . . . . . . . 34,171 35,375 (3.4)
Unearned income and deferred lease costs . . . . . . . . . . . . . . . . . . . . . . . . . . . . . . . . . . . . . . . . . . . . . . . . . (92,710) (95,927) (3.4)
Investment in leveraged leases . . . . . . . . . . . . . . . . . . . . . . . . . . . . . . . . . . . . . . . . . . . . . . . . . . . . . . . . . . . 22,728 21,519 5.6
Total lease financings . . . . . . . . . . . . . . . . . . . . . . . . . . . . . . . . . . . . . . . . . . . . . . . . . . . . . . . . . . . . . . . 850,657 749,482 13.5
Total leasing and equipment finance . . . . . . . . . . . . . . . . . . . . . . . . . . . . . . . . . . . . . . . . . . . . . . . . . . . . . . 1,160,397 1,039,040 11.7
Total consumer, commercial and leasing and equipment finance . . . . . . . . . . . . . . . . . . . . 7,135,135 6,320,784 12.9
Residential real estate . . . . . . . . . . . . . . . . . . . . . . . . . . . . . . . . . . . . . . . . . . . . . . . . . . . . . . . . . . . . . . . . . . . . . . 1,212,643 1,800,344 (32.6)
$8,347,778 $8,121,128 2.8