TCF Bank 2003 Annual Report Download - page 65
Download and view the complete annual report
Please find page 65 of the 2003 TCF Bank annual report below. You can navigate through the pages in the report by either clicking on the pages listed below, or by using the keyword search tool below to find specific information within the annual report.-
 1
1 -
2
-
3
-
4
-
5
-
6
-
7
-
8
-
9
-
10
-
11
-
12
-
13
-
14
-
15
-
16
-
17
-
18
-
19
-
20
-
21
-
22
-
23
-
24
-
25
-
26
-
27
-
28
-
29
-
30
-
31
-
32
-
33
-
34
-
35
-
36
-
37
-
38
-
39
-
40
-
41
-
42
-
43
-
44
-
45
-
46
-
47
-
48
-
49
-
50
-
51
-
52
-
53
-
54
-
 55
55 -
 56
56 -
 57
57 -
 58
58 -
 59
59 -
 60
60 -
 61
61 -
 62
62 -
 63
63 -
 64
64 -
 65
65 -
 66
66 -
 67
67 -
 68
68 -
 69
69 -
 70
70 -
 71
71 -
 72
72 -
 73
73 -
 74
74 -
 75
75 -
76
-
77
-
78
-
79
-
80
-
81
-
82
-
83
-
84
-
85
-
86
 |
 |
2003 Annual Report 63
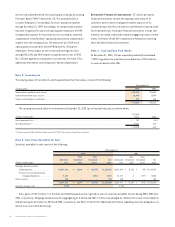
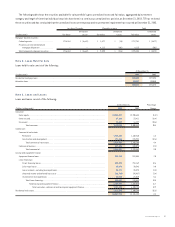
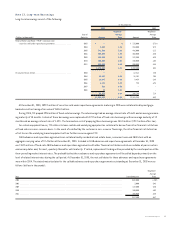
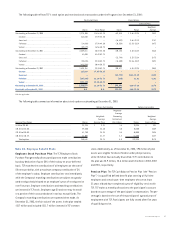
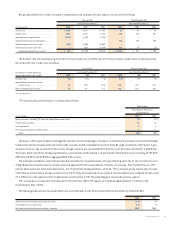
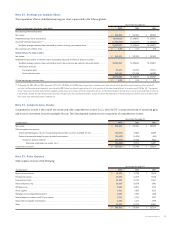
Note 13. Long-term Borrowings
Long-term borrowings consist of the following:
At December 31,
2003 2002
Weighted- Weighted-
Year of Average Average
(Dollars in thousands) Maturity Amount Rate Amount Rate
Federal Home Loan Bank (“FHLB”) advances and
securities sold under repurchase agreements . . . . . . . . . . . . . . . 2003 $– –%$ 135,000 5.76%
2004 3,000 4.76 853,000 5.72
2005 741,500 3.82 446,000 6.13
2006 303,000 4.20 303,000 4.30
2009 122,500 5.25 122,500 5.25
2010 100,000 6.02 100,000 6.02
2011 200,000 4.85 200,000 4.85
1,470,000 4.31 2,159,500 5.51
Discounted lease rentals . . . . . . . . . . . . . . . . . . . . . . . . . . . . . . . . . . 2003 ––62,461 7.30
2004 43,607 6.24 36,101 7.08
2005 18,097 5.68 9,459 6.88
2006 4,134 5.55 723 6.94
2007 522 5.30 – –
2008 53 5.54 ––
66,413 6.04 108,744 7.19
$1,536,413 4.38 $2,268,244 5.59
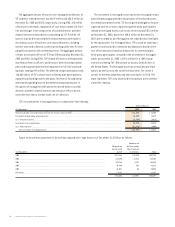
At December 31, 2003, $599.5 million of securities sold under repurchase agreements maturing in 2005 were collateralized by mortgage-
backed securities having a fair value of $655.8 million.
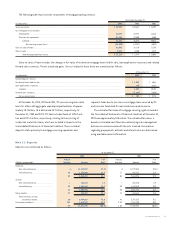
During 2003, TCF prepaid $954 million of fixed-rate borrowings. These borrowings had an average interest rate of 5.66% and an average remain-
ing maturity of 13 months. Certain of these borrowings were replaced with $787 million of fixed-rate borrowings with an average maturity of 12
months and an average interest rate of 1.42%. The termination cost of prepaying these borrowings was $44.3 million ($29.2 million after-tax).
For certain equipment leases, TCF utilizes its lease rentals and underlying equipment as collateral to borrow from other financial institutions
at fixed rates on a non-recourse basis. In the event of a default by the customer in non-recourse financings, the other financial institution has
a first lien on the underlying leased equipment with no further recourse against TCF.
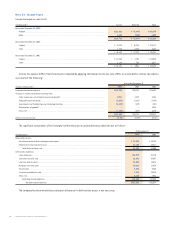
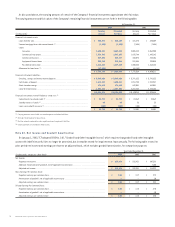
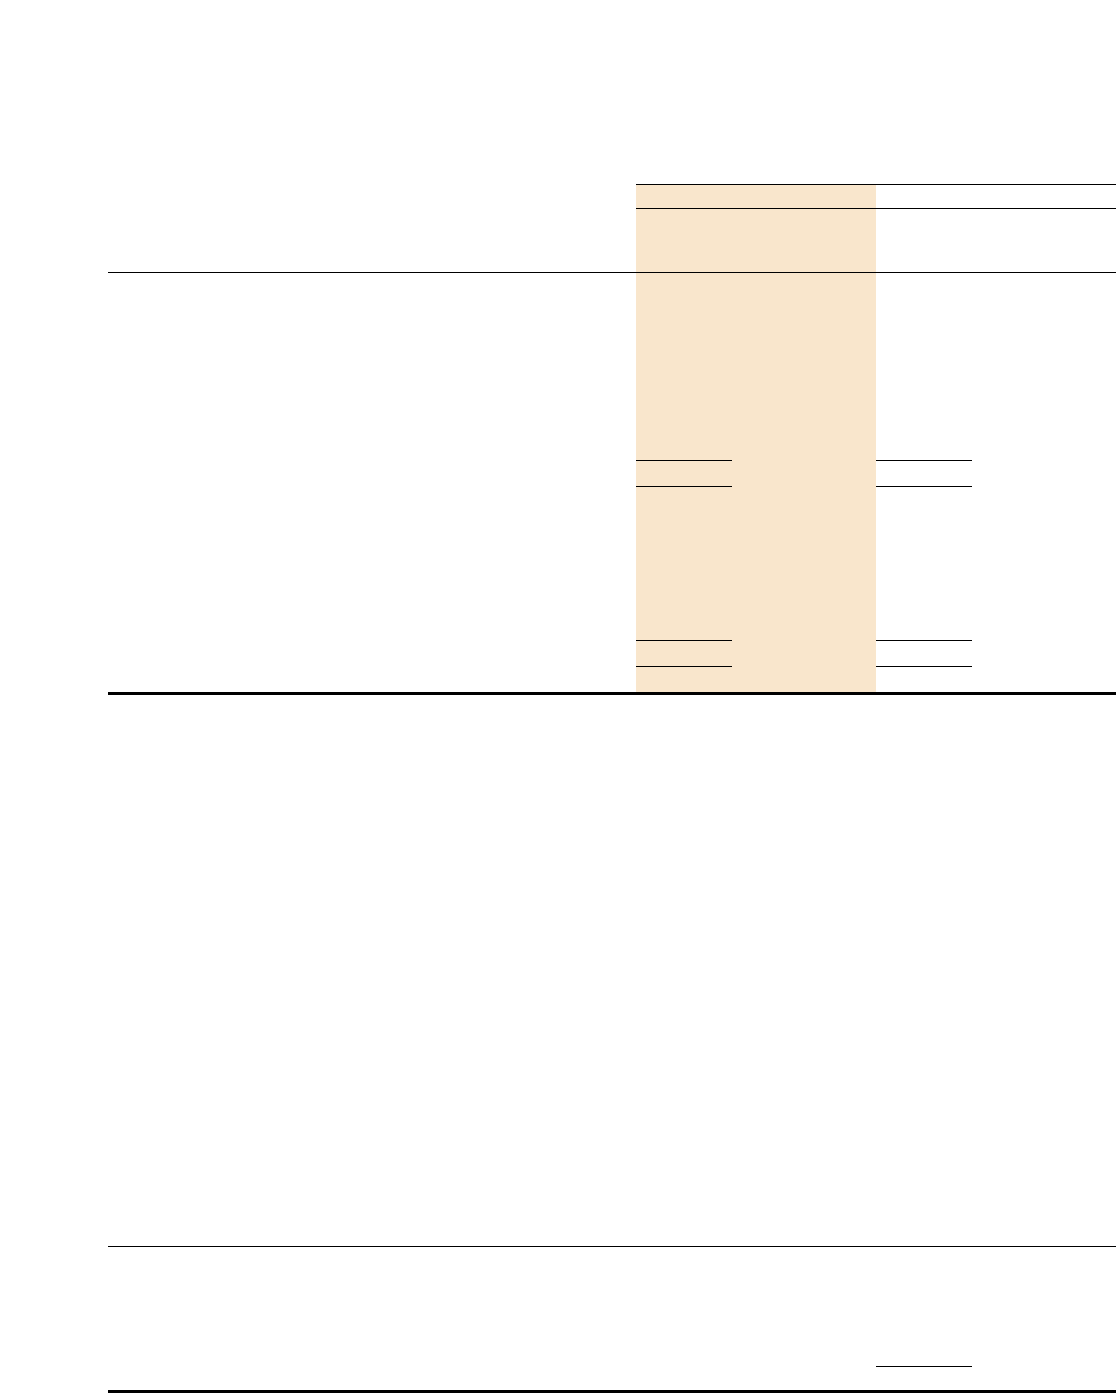
FHLB advances and repurchase agreements are collateralized by residential real estate loans, consumer loans and FHLB stock with an
aggregate carrying value of $2.4 billion at December 31, 2003. Included in FHLB advances and repurchase agreements at December 31, 2003
are $767.5 million of fixed-rate FHLB advances and repurchase agreements with other financial institutions which are callable at par on certain
anniversary dates and, for most, quarterly thereafter until maturity. If called, replacement funding will be provided by the counterparties at the
then-prevailing market interest rates. The probability that these advances and repurchase agreements will be called depends primarily on the
level of related interest rates during the call period. At December 31, 2003, the next call dates for these advances and repurchase agreements
were within 2004. The stated maturity dates for the callable advances and repurchase agreements outstanding at December 31, 2003 were as
follows (dollars in thousands):
Weighted-
Average
Year Stated Maturity Rate
2005 . . . . . . . . . . . . . . . . . . . . . . . . . . . . . . . . . . . . . . . . . . . . . . . . . . . . . . . . . . . . . . . . . . . . . . . . . . . . . . . . . . . . . . . . . . . . . . . . . . . . . . . $342,000 6.20%
2006 . . . . . . . . . . . . . . . . . . . . . . . . . . . . . . . . . . . . . . . . . . . . . . . . . . . . . . . . . . . . . . . . . . . . . . . . . . . . . . . . . . . . . . . . . . . . . . . . . . . 3,000 5.46
2009 . . . . . . . . . . . . . . . . . . . . . . . . . . . . . . . . . . . . . . . . . . . . . . . . . . . . . . . . . . . . . . . . . . . . . . . . . . . . . . . . . . . . . . . . . . . . . . . . . . . 122,500 5.25
2010 . . . . . . . . . . . . . . . . . . . . . . . . . . . . . . . . . . . . . . . . . . . . . . . . . . . . . . . . . . . . . . . . . . . . . . . . . . . . . . . . . . . . . . . . . . . . . . . . . . . 100,000 6.02
2011 . . . . . . . . . . . . . . . . . . . . . . . . . . . . . . . . . . . . . . . . . . . . . . . . . . . . . . . . . . . . . . . . . . . . . . . . . . . . . . . . . . . . . . . . . . . . . . . . . . . 200,000 4.85
$767,500 5.67