TCF Bank 2003 Annual Report Download - page 37
Download and view the complete annual report
Please find page 37 of the 2003 TCF Bank annual report below. You can navigate through the pages in the report by either clicking on the pages listed below, or by using the keyword search tool below to find specific information within the annual report.-
 1
1 -
2
-
3
-
4
-
5
-
6
-
7
-
8
-
9
-
10
-
11
-
12
-
13
-
14
-
15
-
16
-
17
-
18
-
19
-
20
-
21
-
22
-
23
-
24
-
25
-
26
-
 27
27 -
 28
28 -
 29
29 -
 30
30 -
 31
31 -
 32
32 -
 33
33 -
 34
34 -
 35
35 -
 36
36 -
 37
37 -
 38
38 -
 39
39 -
 40
40 -
 41
41 -
 42
42 -
 43
43 -
 44
44 -
 45
45 -
 46
46 -
 47
47 -
48
-
49
-
50
-
51
-
52
-
53
-
54
-
55
-
56
-
57
-
58
-
59
-
60
-
61
-
62
-
63
-
64
-
65
-
66
-
67
-
68
-
69
-
70
-
71
-
72
-
73
-
74
-
75
-
76
-
77
-
78
-
79
-
80
-
81
-
82
-
83
-
84
-
85
-
86
 |
 |

2003 Annual Report 35
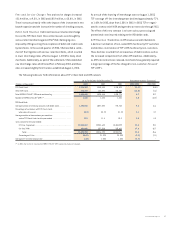
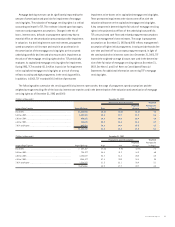
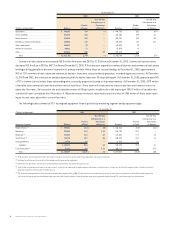
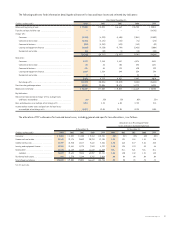
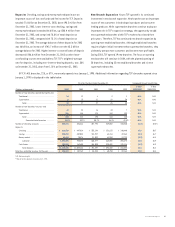
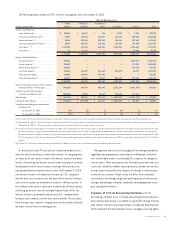
At December 31,
(Dollars in thousands) 2003 2002
Percent of Percent of
Equipment Type Balance Total Balance Total
Technology and data processing . . . . . . . . . . . . . . . . . . . . . . . . . . . . . . . . . . . . . . . . . . . . . $ 249,515 21.5% $ 291,091 28.0%
Specialty vehicles . . . . . . . . . . . . . . . . . . . . . . . . . . . . . . . . . . . . . . . . . . . . . . . . . . . . . . . . 225,073 19.4 149,997 14.4
Manufacturing . . . . . . . . . . . . . . . . . . . . . . . . . . . . . . . . . . . . . . . . . . . . . . . . . . . . . . . . . . . . . . 198,321 17.1 140,014 13.5
Construction . . . . . . . . . . . . . . . . . . . . . . . . . . . . . . . . . . . . . . . . . . . . . . . . . . . . . . . . . . . . 133,104 11.5 87,857 8.5
Trucks and trailers . . . . . . . . . . . . . . . . . . . . . . . . . . . . . . . . . . . . . . . . . . . . . . . . . . . . . . . 89,262 7.7 113,587 10.9
Furniture and fixtures . . . . . . . . . . . . . . . . . . . . . . . . . . . . . . . . . . . . . . . . . . . . . . . . . . . . .54,052 4.7 62,153 6.0
Printing . . . . . . . . . . . . . . . . . . . . . . . . . . . . . . . . . . . . . . . . . . . . . . . . . . . . . . . . . . . . . . . . . . 38,977 3.3 31,181 3.0
Medical . . . . . . . . . . . . . . . . . . . . . . . . . . . . . . . . . . . . . . . . . . . . . . . . . . . . . . . . . . . . . . . . . 33,462 2.9 23,378 2.2
Material handling . . . . . . . . . . . . . . . . . . . . . . . . . . . . . . . . . . . . . . . . . . . . . . . . . . . . . . . . 27,111 2.3 24,749 2.4
Aircraft . . . . . . . . . . . . . . . . . . . . . . . . . . . . . . . . . . . . . . . . . . . . . . . . . . . . . . . . . . . . . . . . . 23,965 2.1 23,420 2.3
Other . . . . . . . . . . . . . . . . . . . . . . . . . . . . . . . . . . . . . . . . . . . . . . . . . . . . . . . . . . . . . . . . . . . . 87,555 7.5 91,613 8.8
Total . . . . . . . . . . . . . . . . . . . . . . . . . . . . . . . . . . . . . . . . . . . . . . . . . . . . . . . . . . . . . . . . . . $1,160,397 100.0% $1,039,040 100.0%
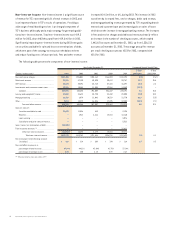
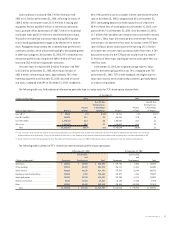
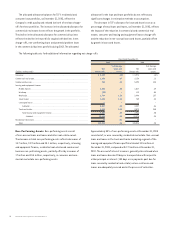
The leasing and equipment finance portfolio increased $121.4
million from December 31, 2002 to $1.2 billion at December 31, 2003
and included the purchase of a specialty vehicles lease portfolio
totaling $58.4 million. This increase was net of a $37.3 million
decline in the Winthrop lease portfolio. Winthrop leases technology
and data processing equipment to companies. Technology spending
by companies has been slow over the past few years. In addition, the
low interest rate environment has led many companies to decide to
purchase instead of lease technology. These factors have contributed
to the reduced levels of new leases at Winthrop. TCF continues to
focus attention on increasing sales efforts at Winthrop to increase
overall balances and maintain its high level of profitability in the busi-
ness. At December 31, 2003, $66.4 million, or 7.4% of TCF’s lease
portfolio, was discounted on a non-recourse basis with other third-
party financial institutions and consequently TCF retains no credit
risk on such amounts. This compares with non-recourse fundings
of $108.7million, or 13.9%, at December 31, 2002. The leasing and
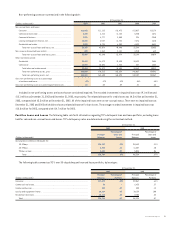
equipment finance portfolio tables above include lease residuals.
Lease residuals represent the estimated fair value of the leased
equipment at the expiration of the initial term of the transaction. At
December 31, 2003, lease residuals, excluding leveraged lease resid-
uals, totaled $34.2 million, down from $35.4 million at December 31,
2002. The lease residuals on leveraged leases are included in invest-
ments in leveraged leases and totaled $18.7 million at December 31,
2003, unchanged from December 31, 2002. Lease residual values are
initially determined at the inception of the lease and are reviewed
on an ongoing basis. Any downward revisions are recorded in the
periods in which they become known.
Included in the investment in leveraged leases, at December 31,
2003, is $19.8 million for a 100% equity interest in a Boeing 767-300
aircraft on lease to Delta Airlines in the United States. An economic
slowdown has adversely impacted the airline industry and could
have an adverse impact on the lessee’s ability to meet its lease obli-
gations and the residual value of the aircraft. The lessee is current
on the lease payments and the lease expires in 2010. This lease rep-
resents TCF’s only material direct exposure to the commercial airline
industry. Total loan and lease originations and purchases for TCF’s
leasing businesses were $618.3 million at December 31, 2003, com-
pared with $518.1 million during 2002 and $492.3 million in 2001. The
backlog of approved transactions increased to $155.2 million at
December 31, 2003, from $140.8 million at December 31, 2002. TCF’s
expanded leasing activity is subject to risk of cyclical downturns and
other adverse economic developments. TCF’s ability to increase its
lease portfolio is dependent upon its ability to place new equipment
in service. In an adverse economic environment, there may be a decline
in the demand for some types of equipment which TCF leases, resulting
in a decline in the amount of new equipment being placed into service
as well as a decline in equipment values for equipment previously
placed in service. TCF Leasing has originated most of its portfolio
during recent periods, and consequently the performance of this
portfolio may not be reflective of future results and credit quality.