TCF Bank 2003 Annual Report Download - page 32
Download and view the complete annual report
Please find page 32 of the 2003 TCF Bank annual report below. You can navigate through the pages in the report by either clicking on the pages listed below, or by using the keyword search tool below to find specific information within the annual report.-
 1
1 -
2
-
3
-
4
-
5
-
6
-
7
-
8
-
9
-
10
-
11
-
12
-
13
-
14
-
15
-
16
-
17
-
18
-
19
-
20
-
21
-
 22
22 -
 23
23 -
 24
24 -
 25
25 -
 26
26 -
 27
27 -
 28
28 -
 29
29 -
 30
30 -
 31
31 -
 32
32 -
 33
33 -
 34
34 -
 35
35 -
 36
36 -
 37
37 -
 38
38 -
 39
39 -
 40
40 -
 41
41 -
 42
42 -
43
-
44
-
45
-
46
-
47
-
48
-
49
-
50
-
51
-
52
-
53
-
54
-
55
-
56
-
57
-
58
-
59
-
60
-
61
-
62
-
63
-
64
-
65
-
66
-
67
-
68
-
69
-
70
-
71
-
72
-
73
-
74
-
75
-
76
-
77
-
78
-
79
-
80
-
81
-
82
-
83
-
84
-
85
-
86
 |
 |

30 TCF Financial Corporation and Subsidiaries
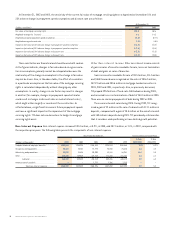
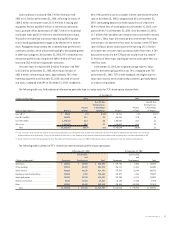
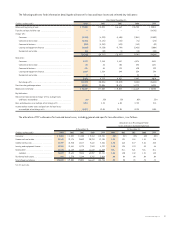
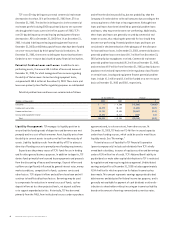
At December 31, 2003 and 2002, the sensitivity of the current fair value of mortgage servicing rights to a hypothetical immediate 10% and
25% adverse change in prepayment speed assumptions and discount rate are as follows:
At December 31,
(Dollars in millions) 2003 2002
Fair value of mortgage servicing rights . . . . . . . . . . . . . . . . . . . . . . . . . . . . . . . . . . . . . . . . . . . . . . . . . . . . . . . . . . . . . . . . . . . . . . . . . $58.0 $62.6
Weighted-average life (in years) . . . . . . . . . . . . . . . . . . . . . . . . . . . . . . . . . . . . . . . . . . . . . . . . . . . . . . . . . . . . . . . . . . . . . . . . . . . . . . . 5.1 $4.3
Weighted average prepayment speed assumption . . . . . . . . . . . . . . . . . . . . . . . . . . . . . . . . . . . . . . . . . . . . . . . . . . . . . . . . . . . . . . . . . 19.0% 22.7%
Weighted average discount rate . . . . . . . . . . . . . . . . . . . . . . . . . . . . . . . . . . . . . . . . . . . . . . . . . . . . . . . . . . . . . . . . . . . . . . . . . . . . . . 7.5% 8.0%
Impact on fair value of 10% adverse change in prepayment speed assumptions . . . . . . . . . . . . . . . . . . . . . . . . . . . . . . . . . . . . . . . . . . $(3.2) $(3.8)
Impact on fair value of 25% adverse change in prepayment speed assumptions . . . . . . . . . . . . . . . . . . . . . . . . . . . . . . . . . . . . . . . . . . $(7.4) $(8.4)
Impact on fair value of 10% adverse change in discount rate . . . . . . . . . . . . . . . . . . . . . . . . . . . . . . . . . . . . . . . . . . . . . . . . . . . . . . . . . $(1.3) $(1.5)
Impact on fair value of 25% adverse change in discount rate . . . . . . . . . . . . . . . . . . . . . . . . . . . . . . . . . . . . . . . . . . . . . . . . . . . . . . . . $(3.3) $(3.5)
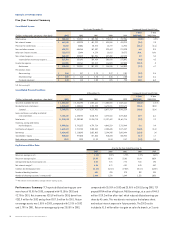
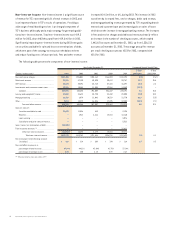
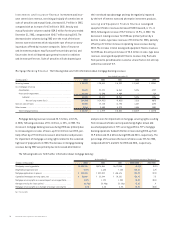
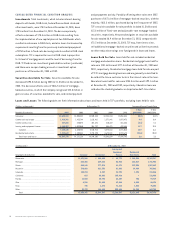
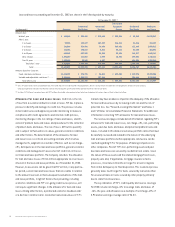
Non-Interest Expense Non-interest expense increased $20.8 million, or 3.9%, in 2003, and $37.3 million, or 7.4%, in 2002, compared with
the respective prior years. The following table presents the components of non-interest expense:
Year Ended December 31, Compound Annual Growth Rate
1-Year 5-Year
(Dollars in thousands) 2003 2002 2001 2000 1999 2003/2002 2003/1998
Compensation and employee benefits . . . . . . . . $302,804 $294,295 $266,818 $238,934 $238,464 2.9% 6.9%
Occupancy and equipment . . . . . . . . . . . . . . . . . 88,423 83,131 78,774 74,938 73,613 6.4 4.4
Advertising and promotions . . . . . . . . . . . . . . . . 25,536 21,894 20,909 19,181 16,981 16.6 5.5
Other . . . . . . . . . . . . . . . . . . . . . . . . . . . . . . . . . 143,346 139,969 127,718 116,443 111,121 2.4 6.1
Subtotal . . . . . . . . . . . . . . . . . . . . . . . . . 560,109 539,289 494,219 449,496 440,179 3.9 6.2
Amortization of goodwill . . . . . . . . . . . . . . . . . . . –– 7,777 7,706 7,713 ––
Total non-interest expense . . . . . . $560,109 $539,289 $501,996 $457,202 $447,892 3.9 5.8
These sensitivities are theoretical and should be used with caution.
As the figures indicate, changes in fair value based on a given varia-
tion in assumptions generally cannot be extrapolated because the
relationship of the change in assumption to the change in fair value
may not be linear. Also, in the above table, the effect of a variation
in a particular assumption on the fair value of the mortgage servicing
rights is calculated independently without changing any other
assumptions. In reality, changes in one factor may result in changes
in another (for example, changes in prepayment speed estimates
could result in changes in discount rates or market interest rates),
which might either magnify or counteract the sensitivities. As
reflected above, a significant increase in future prepayment speeds
can have a significant impact on the impairment of the mortgage
servicing rights. TCF does not use derivatives to hedge its mortgage
servicing rights asset.
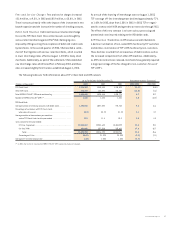
Other Non-interest Income Other non-interest income consists
of gains on sales of securities available for sale, losses on termination
of debt and gains on sales of branches.
Gains on securities available for sale of $32.8 million, $11.5 million
and $863 thousand were recognized on the sales of $816.5 million,
$473.9 million and $33.6 million in mortgage-backed securities in
2003, 2002 and 2001, respectively. Also, as previously discussed,
TCF prepaid $954 million of fixed-rate FHLB advances during 2003,
and recorded losses on terminations of debt of $44.3 million in 2003.
There were no similar prepayments of debt during 2002 or 2001.
There were no branch sales during 2003. During 2002, TCF recog-
nized a gain of $2 million on the sale of a branch with $17.1 million in
deposits, compared with a gain of $3.3 million on the sale of a branch
with $30 million in deposits during 2001. TCF periodically sells branches
that it considers underperforming or have limited growth potential.