TCF Bank 2003 Annual Report Download - page 47
Download and view the complete annual report
Please find page 47 of the 2003 TCF Bank annual report below. You can navigate through the pages in the report by either clicking on the pages listed below, or by using the keyword search tool below to find specific information within the annual report.-
 1
1 -
2
-
3
-
4
-
5
-
6
-
7
-
8
-
9
-
10
-
11
-
12
-
13
-
14
-
15
-
16
-
17
-
18
-
19
-
20
-
21
-
22
-
23
-
24
-
25
-
26
-
27
-
28
-
29
-
30
-
31
-
32
-
33
-
34
-
35
-
36
-
 37
37 -
 38
38 -
 39
39 -
 40
40 -
 41
41 -
 42
42 -
 43
43 -
 44
44 -
 45
45 -
 46
46 -
 47
47 -
 48
48 -
 49
49 -
 50
50 -
 51
51 -
 52
52 -
 53
53 -
 54
54 -
 55
55 -
 56
56 -
 57
57 -
58
-
59
-
60
-
61
-
62
-
63
-
64
-
65
-
66
-
67
-
68
-
69
-
70
-
71
-
72
-
73
-
74
-
75
-
76
-
77
-
78
-
79
-
80
-
81
-
82
-
83
-
84
-
85
-
86
 |
 |
2003 Annual Report 45
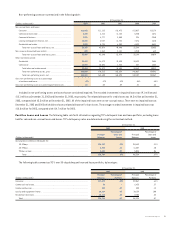
As previously noted, TCF also utilizes simulation models to esti-
mate the near-term effects (next twelve months) of changing inter-
est rates on its net interest income. Net interest income simulation
involves forecasting net interest income under a variety of scenarios,
including the level of interest rates, the shape of the yield curve,
and spreads between market interest rates. At December 31, 2003,
net interest income is estimated to increase by 2.3%, compared
with the base case scenario, over the next twelve months if interest
rates were to sustain an immediate increase of 100 basis points. In
the unlikely event interest rates were to decline by 100 basis points,
reflecting an interest rate on overnight Federal Funds of 0%, net
interest income is estimated to decrease by 5%, compared with
the base case scenario, over the next twelve months. The decrease
from the base case scenario is largely due to an assumed continued
decrease in total interest-earning assets.
Management exercises its best judgment in making assumptions
regarding loan prepayments, early deposit withdrawals, and other
non-controllable events in estimating TCF’s exposure to changes in
interest rates. These assumptions are inherently uncertain and, as a
result, the simulation models cannot precisely estimate net interest
income or precisely predict the impact of a change in interest rates
on net interest income. Actual results will differ from simulated
results due to the timing, magnitude and frequency of interest rate
changes and changes in market conditions and management strate-
gies, among other factors.
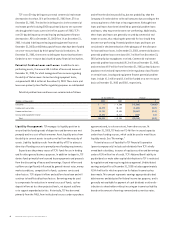
Summary of Critical Accounting Estimates Critical
accounting estimates occur in certain accounting policies and proce-
dures and are particularly susceptible to significant change. Policies
that contain critical accounting estimates include the determination
of the allowance for loan and lease losses, mortgage servicing rights,
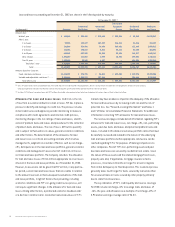
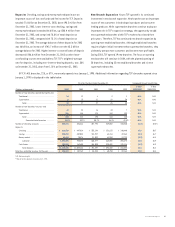
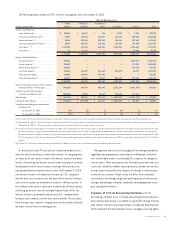
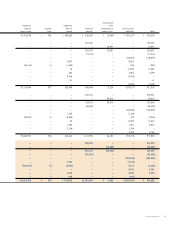
The following table summarizes TCF’s interest-rate gap position at December 31, 2003:
Maturity/Rate Sensitivity
Within 30 Days to 6 Months to
(Dollars in thousands) 30 Days 6 Months 1 Year 1 to 3 Years 3+ Years Total
Interest-earning assets:
Loans held for sale . . . . . . . . . . . . . . . . . . $297,068 $ 26,837 $ 674 $ 2,855 $ 7,938 $ 335,372
Securities available for sale (1) . . . . . . . . . 29,827 154,165 192,421 461,476 695,399 1,533,288
Real estate loans (1) . . . . . . . . . . . . . . . . . . 34,190 219,260 225,849 345,461 387,883 1,212,643
Leasing and equipment finance (1) . . . . . . . 38,964 165,563 182,498 496,363 277,009 1,160,397
Other loans (1) (2) . . . . . . . . . . . . . . . . . . . . 1,313,030 613,204 624,448 2,267,208 1,156,848 5,974,738
Investments . . . . . . . . . . . . . . . . . . . . . . . 21 51,157 – – 24,045 75,223
1,713,100 1,230,186 1,225,890 3,573,363 2,549,122 10,291,661
Interest-bearing liabilities:
Checking deposits (3) . . . . . . . . . . . . . . . . . . . 203,034 – – – 3,045,378 3,248,412
Savings deposits (3) . . . . . . . . . . . . . . . . . . . 928,532 – – – 977,391 1,905,923
Money market deposits(3) . . . . . . . . . . . . . 405,591 – – – 439,700 845,291
Certificate deposits . . . . . . . . . . . . . . . . . . . 164,318 631,897 414,166 336,970 64,772 1,612,123
Short-term borrowings . . . . . . . . . . . . . . . . 290,689 190,025 397,698 – – 878,412
Long-term borrowings (4) . . . . . . . . . . . . . . 109,134 21,834 17,541 964,109 423,795 1,536,413
2,101,298 843,756 829,405 1,301,079 4,951,036 10,026,574
Interest-earning assets over (under) interest-
bearing liabilities (Primary gap) . . . . . . . . (388,198) 386,430 396,485 2,272,284 (2,401,914) 265,087
Impact of unsettled transactions:
Securities available for sale . . . . . . . . . . . . (283,678) 13,546 36,692 106,283 127,157 –
Adjusted gap . . . . . . . . . . . . . . . . . . . . . . . . . . . $ (671,876) $ 399,976 $ 433,177 $ 2,378,567 $(2,274,757) $ 265,087
Cumulative adjusted gap . . . . . . . . . . . . . . . . . . $ (671,876) $ (271,900) $ 161,277 $ 2,539,844 $ 265,087 $ 265,087
Cumulative adjusted gap as a percentage
of total assets:
At December 31, 2003 . . . . . . . . . . . . . . (6)% (2)% 1% 22% 2% 2%
At December 31, 2002 . . . . . . . . . . . . . . (4)% 4 % 9% 19% 3% 3%
(1) Based upon contractual maturity, repricing date, if applicable, scheduled repayments of principal and projected prepayments of principal based upon experience and third party projections.
(2) At December 31, 2003, $1.7 billion of consumer variable rate loans and $379 million of commercial variable rate loans were at their floor rate and were treated as fixed-rate for gap reporting purposes.
At December 31, 2002, $1.1 billion of consumer variable rate loans were at their floor rate and were treated as fixed-rate.
(3) Includes non-interest bearing deposits. At December 31, 2003, 6% of checking deposits, 49% of savings deposits, and 48% of money market deposits are included in amounts repricing within one year.
All remaining checking, savings and money market deposits are assumed to mature in the “3+ Years” category. While management believes that these assumptions are reasonable, no assurance can
be given that amounts on deposit in checking, savings, and money market accounts will not significantly change or be repriced in the event of a general change in interest rates. At December 31, 2002,
7% of checking deposits, 59% of savings deposits, and 53% of money market deposits were included in amounts repricing within one year and 18% of savings deposits were included in the “1 to 3 Years”
category.
(4) Includes $767.5 million of callable borrowings. At December 31, 2003, the contract rates on all callable borrowings exceeded current market rates.