TCF Bank 2003 Annual Report Download - page 29
Download and view the complete annual report
Please find page 29 of the 2003 TCF Bank annual report below. You can navigate through the pages in the report by either clicking on the pages listed below, or by using the keyword search tool below to find specific information within the annual report.-
 1
1 -
2
-
3
-
4
-
5
-
6
-
7
-
8
-
9
-
10
-
11
-
12
-
13
-
14
-
15
-
16
-
17
-
18
-
 19
19 -
 20
20 -
 21
21 -
 22
22 -
 23
23 -
 24
24 -
 25
25 -
 26
26 -
 27
27 -
 28
28 -
 29
29 -
 30
30 -
 31
31 -
 32
32 -
 33
33 -
 34
34 -
 35
35 -
 36
36 -
 37
37 -
 38
38 -
 39
39 -
40
-
41
-
42
-
43
-
44
-
45
-
46
-
47
-
48
-
49
-
50
-
51
-
52
-
53
-
54
-
55
-
56
-
57
-
58
-
59
-
60
-
61
-
62
-
63
-
64
-
65
-
66
-
67
-
68
-
69
-
70
-
71
-
72
-
73
-
74
-
75
-
76
-
77
-
78
-
79
-
80
-
81
-
82
-
83
-
84
-
85
-
86
 |
 |
2003 Annual Report 27
Fees and Service Charges Fees and service charges increased
$21.4 million, or 9.5%, in 2003 and $30.9 million, or 15.8%, in 2002.
These increases primarily reflect the impact of the investment in new
branch expansion and the increase in the number of checking accounts.
Debit Card Revenue Debit card revenue includes interchange
fees on the TCF Check Card. Class action lawsuits were brought by
various retail merchants against VISA®USA challenging rules
imposed by VISA governing the acceptance of debit and credit cards
by merchants. In the second quarter of 2003, VISA reached a settle-
ment of the litigation with various retail merchants, which resulted
in lower interchange rates effective August 1, 2003 for many retail
merchants. Additionally, as part of the settlement, VISA established
new interchange rates which took effect in February 2004, and these
rates increased slightly from the rates established August 1, 2003.
As a result of the lowering of interchange rates on August 1, 2003,
TCF’s average off-line interchange rate declined approximately 7.7%
to 1.43% for 2003, down from 1.55% in 2002. In 2003, TCF re-negoti-
ated its contract with VISA and agreed to an extension through 2013.
The effect of this new contract is to lower various processing and
promotional costs incurred relating to the VISA debit cards.
ATM Revenue The declines in ATM revenue were attributable to
a decline in utilization of non-owned ATM machines by TCF customers
and declines in utilization of TCF’s ATM machines by non-customers.
These declines resulted from increased use of debit cards as well as
the increased competition from other ATM machines. Additionally,
as ATM site contracts are renewed, merchants have generally required
a larger percentage of the fee charged to non-customers for use of
TCF’s ATM’s.
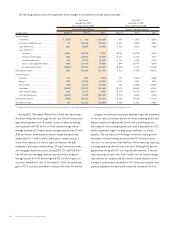
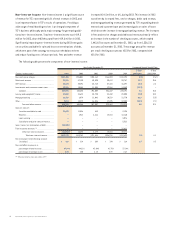
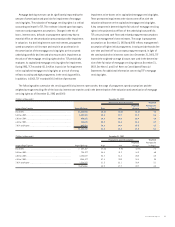
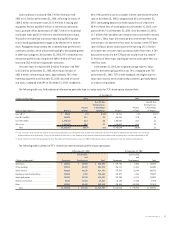
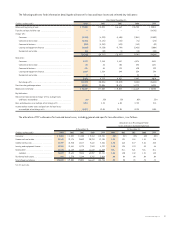
The following table sets forth information about TCF’s Check Card and ATM network:
At or For the Year Ended December 31, Percentage Increase (Decrease)
(Dollars in thousands) 2003 2002 2001 2003/2002 2002/2001
TCF Check Cards . . . . . . . . . . . . . . . . . . . . . . . . . . . . . . . . . . . . . . . . . 1,534,383 1,380,893 1,195,522 11.1% 15.5%
Other ATM Cards . . . . . . . . . . . . . . . . . . . . . . . . . . . . . . . . . . . . . . . . . . . . 124,277 144,592 158,254 (14.0) (8.6)
Total EXPRESS TELLER®ATM cards outstanding . . . . . . . . . . . . . . . . . . . 1,658,660 1,525,485 1,353,776 8.7 12.7
Number of EXPRESS TELLER®ATM’s(1) . . . . . . . . . . . . . . . . . . . . . . . . . . . 1,166 1,143 1,341 2.0 (14.8)
TCF Check Card:
Average number of checking accounts with debit cards . . . . . . . . . . . 1,193,936 1,087,592 974,734 9.8 11.6
Percentage of customers with TCF Check Cards
who were active users . . . . . . . . . . . . . . . . . . . . . . . . . . . . . . . . . 54.3% 53.2% 51.3% 2.1 3.7
Average number of transactions per month on
active TCF Check Cards for the year ended . . . . . . . . . . . . . . . . . 12.5 11.8 10.9 5.9 8.3
Sales volume for the year ended:
Off-line (Signature) . . . . . . . . . . . . . . . . . . . . . . . . . . . . . . . . . . . . . . . . . $3,543,657 $2,958,633 $2,404,299 19.8 23.1
On-line (PIN) . . . . . . . . . . . . . . . . . . . . . . . . . . . . . . . . . . . . . . . . . 355,045 257,560 155,462 37.8 65.7
Total . . . . . . . . . . . . . . . . . . . . . . . . . . . . . . . . . . . . . . . . . . . . . $3,898,702 $3,216,193 $2,559,761 21.2 25.6
Percentage off-line . . . . . . . . . . . . . . . . . . . . . . . . . . . . . . . . . . . 90.89% 91.99% 93.93% (1.2) (2.1)
Average off-line interchange rate . . . . . . . . . . . . . . . . . . . . . . . . . . . 1.43% 1.55% 1.55% (7.7) –
(1) In 2002, the contracts covering 256 EXPRESS TELLER®ATM’s expired and were not renewed.