Sharp 2007 Annual Report Download - page 63
Download and view the complete annual report
Please find page 63 of the 2007 Sharp annual report below. You can navigate through the pages in the report by either clicking on the pages listed below, or by using the keyword search tool below to find specific information within the annual report.-
 1
1 -
2
-
3
-
4
-
5
-
6
-
7
-
8
-
9
-
10
-
11
-
12
-
13
-
14
-
15
-
16
-
17
-
18
-
19
-
20
-
21
-
22
-
23
-
24
-
25
-
26
-
27
-
28
-
29
-
30
-
31
-
32
-
33
-
34
-
35
-
36
-
37
-
38
-
39
-
40
-
41
-
42
-
43
-
44
-
45
-
46
-
47
-
48
-
49
-
50
-
51
-
52
-
 53
53 -
 54
54 -
 55
55 -
 56
56 -
 57
57 -
 58
58 -
 59
59 -
 60
60 -
 61
61 -
 62
62 -
 63
63 -
 64
64 -
 65
65 -
 66
66 -
 67
67 -
 68
68
 |
 |

Sharp Annual Report 2007 61
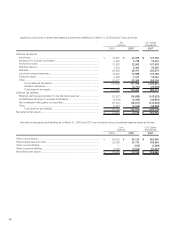
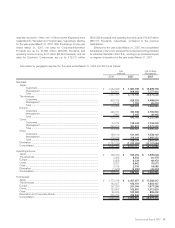
Information by geographic segment for the years ended March 31, 2006 and 2007 is as follows:
Net Sales:
Japan:
Customers..........................................................................................
Intersegment ......................................................................................
Total...................................................................................................
The Americas:
Customers..........................................................................................
Intersegment ......................................................................................
Total ..................................................................................................
Europe:
Customers .........................................................................................
Intersegment ......................................................................................
Total ..................................................................................................
China:
Customers .........................................................................................
Intersegment ......................................................................................
Total ..................................................................................................
Other:
Customers..........................................................................................
Intersegment ......................................................................................
Total...................................................................................................
Elimination...................................................................................................
Consolidated ...............................................................................................
Operating Income:
Japan ..........................................................................................................
The Americas ..............................................................................................
Europe ........................................................................................................
China...........................................................................................................
Other...........................................................................................................
Elimination...................................................................................................
Consolidated ...............................................................................................
Total Assets:
Japan ..........................................................................................................
The Americas ..............................................................................................
Europe ........................................................................................................
China...........................................................................................................
Other...........................................................................................................
Elimination and Corporate Assets ................................................................
Consolidated ...............................................................................................
$ 15,899,136
7,777,402
23,676,538
4,498,504
60,479
4,558,983
4,190,923
29,445
4,220,368
1,106,402
3,375,025
4,481,427
1,038,120
1,865,333
2,903,453
(13,107,684)
$ 26,733,085
$ 1,395,008
81,479
69,479
75,573
18,085
(45,342)
$ 1,594,282
$ 17,589,547
1,653,427
1,977,299
1,312,820
885,402
1,955,949
$ 25,374,444
¥ 1,860,199
909,956
2,770,155
526,325
7,076
533,401
490,338
3,445
493,783
129,449
394,878
524,327
121,460
218,244
339,704
(1,533,599)
¥ 3,127,771
¥ 163,216
9,533
8,129
8,842
2,116
(5,305)
¥ 186,531
¥ 2,057,977
193,451
231,344
153,600
103,592
228,846
¥ 2,968,810
¥ 1,742,349
708,691
2,451,040
409,105
7,715
416,820
425,371
3,662
429,033
62,174
290,915
353,089
158,110
176,246
334,356
(1,187,229)
¥ 2,797,109
¥ 146,370
3,358
5,856
6,757
3,315
(1,946)
¥ 163,710
¥ 1,777,418
142,627
147,290
120,693
96,535
275,736
¥ 2,560,299
200720072006
Yen
(millions) U.S. Dollars
(thousands)
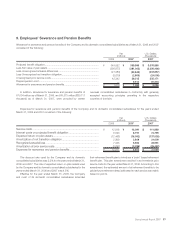
originally included in “Other, net” of Other Income (Expenses) were
reclassified into “Net sales” and “Cost of sales, ”respectively, effective
for the year ended March 31, 2007. With this change, for the year
ended March 31, 2007, net sales for Consumer/Information
Products are up by ¥3,583 million ($30,624 thousand) and
operating income is up by ¥731 million ($6,248 thousand), and net
sales for Electronic Components are up by ¥12,031 million
($102,829 thousand), and operating income is up by ¥10,425 million
($89,103 thousand), respectively, compared to the previous
classification.
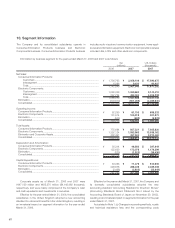
Effective for the year ended March 31, 2007, the consolidated
subsidiaries in the U.S.A. adopted the revised accounting standard
for retirement benefits in the U.S.A., resulting in an immaterial impact
on segment information for the year ended March 31, 2007.