Sharp 2007 Annual Report Download - page 38
Download and view the complete annual report
Please find page 38 of the 2007 Sharp annual report below. You can navigate through the pages in the report by either clicking on the pages listed below, or by using the keyword search tool below to find specific information within the annual report.-
 1
1 -
2
-
3
-
4
-
5
-
6
-
7
-
8
-
9
-
10
-
11
-
12
-
13
-
14
-
15
-
16
-
17
-
18
-
19
-
20
-
21
-
22
-
23
-
24
-
25
-
26
-
27
-
 28
28 -
 29
29 -
 30
30 -
 31
31 -
 32
32 -
 33
33 -
 34
34 -
 35
35 -
 36
36 -
 37
37 -
 38
38 -
 39
39 -
 40
40 -
 41
41 -
 42
42 -
 43
43 -
 44
44 -
 45
45 -
 46
46 -
 47
47 -
 48
48 -
49
-
50
-
51
-
52
-
53
-
54
-
55
-
56
-
57
-
58
-
59
-
60
-
61
-
62
-
63
-
64
-
65
-
66
-
67
-
68
 |
 |

36
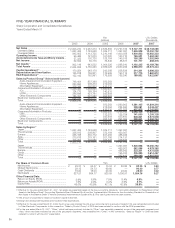
FIVE-YEAR FINANCIAL SUMMARY
Sharp Corporation and Consolidated Subsidiaries
Years Ended March 31
200720072006200520042003
Yen
(millions) U.S. Dollars
(thousands)
*1
Effective for the year ended March 31, 2007, net assets are presented based on the new accounting standards, “Accounting Standard for Presentation of Net
Assets in the Balance Sheet” (Accounting Standards Board Statement No.5) and the “Implementation Guidance for the Accounting Standard for Presentation of
Net Assets in the Balance Sheet” (Financial Standards Implementation Guidance No.8). Prior year figures have not been restated.
*2
The amount of properties for lease is included in capital investment.
*3
Design and development expenses are included in R&D expenditures.
*4
Effective for the year ended March 31, 2006, the IC group was renamed the LSI group and some items previously included in ICs was reclassified and included
in Other Electronic Components. In this connection, “Sales by Product Group” of 2005 has been restated to conform with the 2006 presentation.
*5
For the year ended March 31, 2007, “China,” which had been previously included in “Other,” was separately presented as one of the geographic segments and
“Asia,” which had been indicated as one of the geographic segments, was reclassified into “Other.” In this connection, “Sales by Region” of 2006 has been
restated to conform with the 2007 presentation.
Net Sales .........................................................
Domestic Sales ...............................................
Overseas Sales ...............................................
Operating Income ...........................................
Income before Income Taxes and Minority Interests
...
Net Income......................................................
Net Assets*1....................................................
Total Assets ....................................................
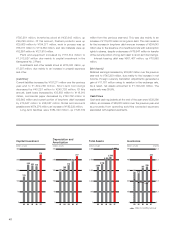
Capital Investment*2.......................................
Depreciation and Amortization.......................
R&D Expenditures*3........................................
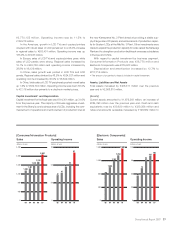
Sales by Product Group*4
Audio-Visual and Communication Equipment
......
Home Appliances.........................................
Information Equipment.....................................
Consumer/Information Products .....................
ICs ..............................................................
LCDs ...........................................................
Other Electronic Components .....................
Electronic Components...................................
Total ...............................................................
Audio-Visual and Communication Equipment
......
Home Appliances.........................................
Information Equipment.....................................
Consumer/Information Products .....................
LSIs .............................................................
LCDs ...........................................................
Other Electronic Components .....................
Electronic Components...................................
Total ...............................................................
Sales by Region*5
Japan..............................................................
The Americas..................................................
Europe............................................................
Asia.................................................................
Other ..............................................................
Total ...............................................................
Japan..............................................................
The Americas..................................................
Europe............................................................
China ..............................................................
Other ..............................................................
Total ...............................................................
Per Share of Common Stock
Net Income .....................................................
Diluted Net Income .........................................
Cash Dividends ..............................................
Net Assets ......................................................
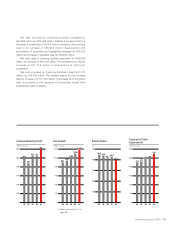
Other Financial Data
Return on Equity (ROE) ...................................
Return on Assets (ROA) ..................................
Equity Ratio .....................................................
$ 26,733,085
13,050,752
13,682,333
1,594,282
1,352,949
869,376
10,189,786
25,374,444
2,686,333
1,860,812
1,622,667
—
—
—
—
—
—
—
—
—
11,804,316
2,043,427
3,742,932
17,590,675
1,205,128
5,374,538
2,562,744
9,142,410
26,733,085
—
—
—
—
—
—
13,050,752
4,979,385
4,472,658
2,614,487
1,615,803
26,733,085
$ 0.80
0.77
0.22
9.27
—
—
—
¥ 3,127,771
1,526,938
1,600,833
186,531
158,295
101,717
1,192,205
2,968,810
314,301
217,715
189,852
—
—
—
—
—
—
—
—
—
1,381,105
239,081
437,923
2,058,109
141,000
628,821
299,841
1,069,662
3,127,771
—
—
—
—
—
—
1,526,938
582,588
523,301
305,895
189,049
3,127,771
¥ 93.25
90.00
26.00
1,084.76
8.9%
3.7%
39.9%
¥ 2,797,109
1,397,081
1,400,028
163,710
140,018
88,671
1,098,910
2,560,299
238,839
193,114
185,240
—
—
—
—
—
—
—
—
—
1,090,905
224,650
421,208
1,736,763
135,754
633,493
291,099
1,060,346
2,797,109
1,397,081
450,307
488,945
214,131
246,645
2,797,109
1,397,081
450,307
488,945
195,333
265,443
2,797,109
¥ 80.85
—
22.00
1,006.91
8.4%
3.6%
42.9%
¥ 2,539,859
1,329,711
1,210,148
151,020
128,184
76,845
1,004,326
2,385,026
243,388
175,969
175,558
972,563
212,064
416,310
1,600,937
140,915
543,804
254,203
938,922
2,539,859
972,563
212,064
416,310
1,600,937
132,375
543,804
262,743
938,922
2,539,859
1,329,711
372,184
407,455
207,186
223,323
2,539,859
—
—
—
—
—
—
¥ 70.04
69.60
20.00
920.09
7.9%
3.4%
42.1%
¥ 2,257,273
1,143,548
1,113,725
121,670
102,720
60,715
943,532
2,150,250
248,178
159,831
162,991
837,390
208,473
392,833
1,438,696
169,754
421,741
227,082
818,577
2,257,273
—
—
—
—
—
—
—
—
—
1,143,548
308,807
330,772
279,161
194,985
2,257,273
—
—
—
—
—
—
¥ 55.37
54.73
18.00
864.77
6.6%
2.9%
43.9%
¥ 2,003,210
1,057,405
945,805
99,466
57,325
32,594
902,116
2,004,832
170,254
145,818
152,145
746,404
223,890
376,106
1,346,400
124,773
346,646
185,391
656,810
2,003,210
—
—
—
—
—
—
—
—
—
1,057,405
336,815
235,168
270,618
103,204
2,003,210
—
—
—
—
—
—
¥ 29.37
29.15
15.00
827.51
3.6%
1.6%
45.0%
Yen U.S. Dollars
(Sales to Outside Customers)