Sharp 2007 Annual Report Download - page 41
Download and view the complete annual report
Please find page 41 of the 2007 Sharp annual report below. You can navigate through the pages in the report by either clicking on the pages listed below, or by using the keyword search tool below to find specific information within the annual report.-
 1
1 -
2
-
3
-
4
-
5
-
6
-
7
-
8
-
9
-
10
-
11
-
12
-
13
-
14
-
15
-
16
-
17
-
18
-
19
-
20
-
21
-
22
-
23
-
24
-
25
-
26
-
27
-
28
-
29
-
30
-
 31
31 -
 32
32 -
 33
33 -
 34
34 -
 35
35 -
 36
36 -
 37
37 -
 38
38 -
 39
39 -
 40
40 -
 41
41 -
 42
42 -
 43
43 -
 44
44 -
 45
45 -
 46
46 -
 47
47 -
 48
48 -
 49
49 -
 50
50 -
 51
51 -
52
-
53
-
54
-
55
-
56
-
57
-
58
-
59
-
60
-
61
-
62
-
63
-
64
-
65
-
66
-
67
-
68
 |
 |
Sharp Annual Report 2007 39
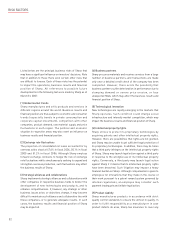
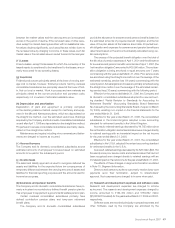
03 04 05 0706
62
81
43
47
0
30
60
90
57
03 04 05 0706
1,352
1,447
1,612
1,742
2,067
0
400
800
1,200
1,600
2,000
2,400
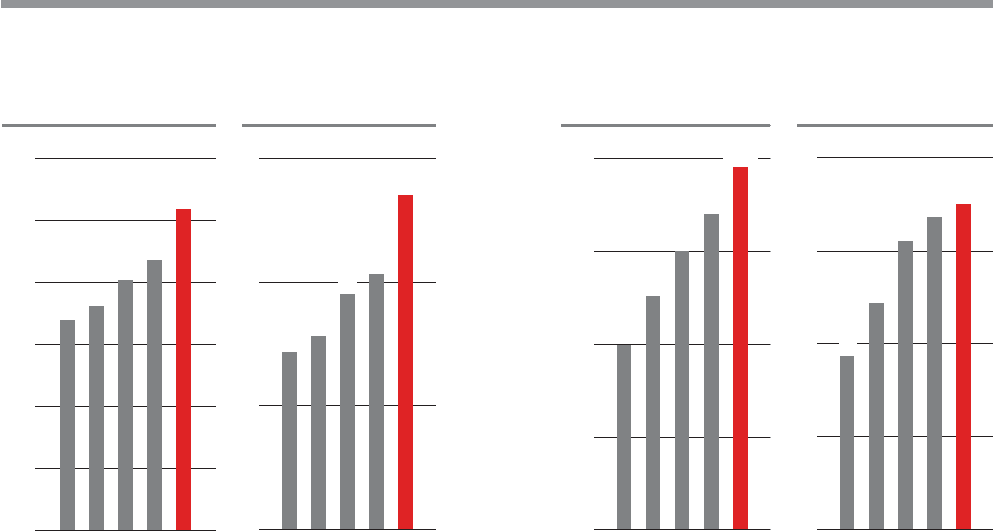
03 04 05 0706
1,358
1,561
793
1,004
1,197
0
400
800
1,200
1,600
03 04 05 0706
0
30
60
90
120
105
56
73
93
101
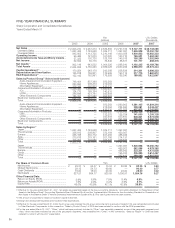
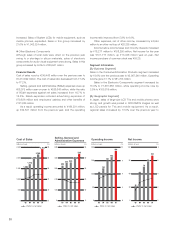
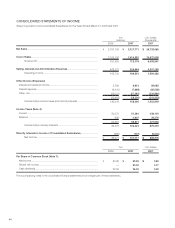
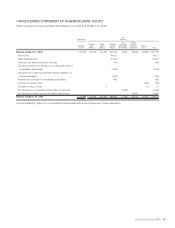
¥2,770,155 million. Operating income rose by 11.5% to
¥163,216 million.
In the Americas, growth in LCD TVs and copiers/printers
coupled with robust sales of LCD panels led to a 28.0% increase
in regional sales to ¥533,401 million. Operating income was up
183.9% to ¥9,533 million.
In Europe, sales of LCD TVs and copiers/printers grew, while
sales of LCD panels were strong. Regional sales increased by
15.1% to ¥493,783 million and operating income increased by
38.8% to ¥8,129 million.
In China, sales growth was posted in LCD TVs and LCD
panels. Regional sales climbed by 48.5% to ¥524,327 million and
operating income increased by 30.9% to ¥8,842 million.
In Other, brisk sales of LCD TV peripherals pushed overall sales
up 1.6% to ¥339,704 million. Operating income was down 36.2%
to ¥2,116 million due primarily to a decline in market prices.
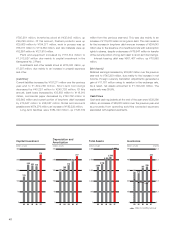
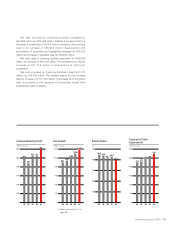
Capital Investment*and Depreciation
Capital investment for the fiscal year was ¥314,301 million, up 31.6%
from the previous year. The majority of this was aggressive invest-
ment in the Sharp’s core business area of LCDs, including the com-
mencement of operations and reinforcement of production lines at
the new Kameyama No. 2 Plant aimed at providing a stable sup-
ply of large-size LCD panels, and enhancement of production capac-
ity for System LCDs at the Mie No. 3 Plant. Other investments were
made to expand the production capacity for solar cells at the Katsuragi
Plant and to strengthen production facilities at overseas subsidiaries
in Europe and China.
With regard to capital investment by business segment,
Consumer/Information Products was ¥38,778 million and
Electronic Components was ¥275,523 million.
Depreciation and amortization increased by 12.7% to
¥217,715 million.
*The amount of properties for lease is included in capital investment.
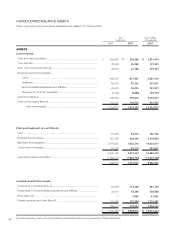
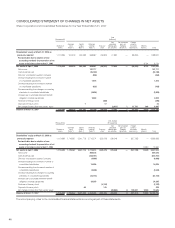
Assets, Liabilities and Net Assets
Total assets increased by ¥408,511 million over the previous
year-end to ¥2,968,810 million.
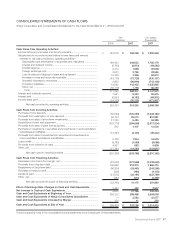
[Assets]
Current assets amounted to ¥1,679,263 million, an increase of
¥284,390 million over the previous year-end. Cash and cash
equivalents rose by ¥29,820 million to ¥329,286 million and
notes and accounts receivable increased by ¥126,582 million to
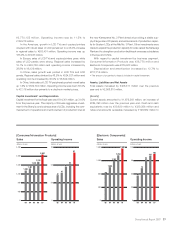
Operating IncomeSales Sales Operating Income
[Consumer/Information Products] [Electronic Components]
(billions of yen) (billions of yen) (billions of yen) (billions of yen)