Sharp 2007 Annual Report Download - page 40
Download and view the complete annual report
Please find page 40 of the 2007 Sharp annual report below. You can navigate through the pages in the report by either clicking on the pages listed below, or by using the keyword search tool below to find specific information within the annual report.-
 1
1 -
2
-
3
-
4
-
5
-
6
-
7
-
8
-
9
-
10
-
11
-
12
-
13
-
14
-
15
-
16
-
17
-
18
-
19
-
20
-
21
-
22
-
23
-
24
-
25
-
26
-
27
-
28
-
29
-
 30
30 -
 31
31 -
 32
32 -
 33
33 -
 34
34 -
 35
35 -
 36
36 -
 37
37 -
 38
38 -
 39
39 -
 40
40 -
 41
41 -
 42
42 -
 43
43 -
 44
44 -
 45
45 -
 46
46 -
 47
47 -
 48
48 -
 49
49 -
 50
50 -
51
-
52
-
53
-
54
-
55
-
56
-
57
-
58
-
59
-
60
-
61
-
62
-
63
-
64
-
65
-
66
-
67
-
68
 |
 |

38
03 04 05 0706
99
151
0
50
100
150
200
163
186
121
0
3
6
9
12
0
30
60
90
120
03 04 05 0706
0
2
4
6
8
101
60
76
32
88
03 04 05 0706
1,509
1,713
1,959
2,165
0
500
1,000
1,500
2,000
2,500
65
70
75
80
85
90
2,414
03 04 05 0706
393
429
0
120
240
360
480
600
468
526
422
0
10
20
30
40
50
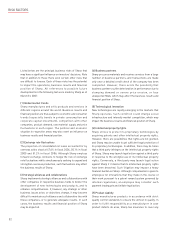
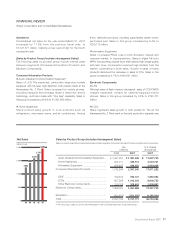
increased. Sales of System LCDs for mobile equipment, such as
mobile phones, expanded. Sales in this group increased by
21.6% to ¥1,042,324 million.
●Other Electronic Components
Although sales of solar cells were down on the previous year
owing to a shortage in silicon materials, sales of electronic
components for audio-visual equipment were strong. Sales in this
group increased by 6.0% to ¥328,641 million.
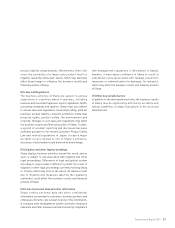
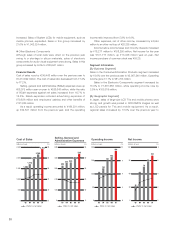
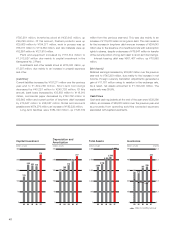
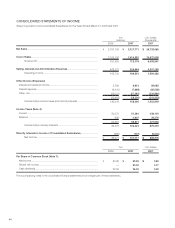
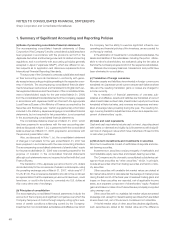
Financial Results
Cost of sales rose by ¥249,466 million over the previous year to
¥2,414,592 million. The cost of sales ratio decreased from 77.4%
to 77.2%.
Selling, general and administrative (SG&A) expenses were up
¥58,375 million year-on-year to ¥526,648 million, while the ratio
of SG&A expenses against net sales increased from 16.7% to
16.8%. SG&A expenses included advertising expenses of
¥70,836 million and employees’ salaries and other benefits of
¥121,826 million.
As a result, operating income amounted to ¥186,531 million,
up ¥22,821 million from the previous year, and the operating
income ratio improved from 5.9% to 6.0%.
Other expenses, net of other income, increased by ¥4,544
million to an other net loss of ¥28,236 million.
Income before income taxes and minority interests increased
by ¥18,277 million to ¥158,295 million. Net income for the year
was ¥101,717 million, up ¥13,046 million year-on-year. Net
income per share of common stock was ¥93.25.
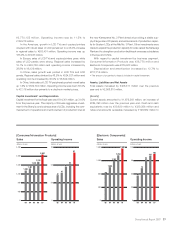
Segment Information
[By Business Segment]
Sales in the Consumer/Information Products segment increased
by 18.6% over the previous year to ¥2,067,540 million. Operating
income grew 31.1% to ¥81,705 million.
Sales in the Electronic Components segment increased by
15.0% to ¥1,561,686 million, while operating income rose by
3.5% to ¥105,519 million.
[By Geographic Segment]
In Japan, sales of large-size LCD TVs and mobile phones were
strong, and growth was posted in CCD/CMOS imagers as well
as LCD panels for TVs and mobile equipment. As a result,
regional sales increased by 13.0% over the previous year to
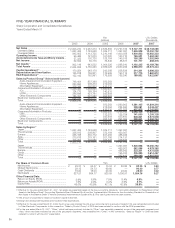
Operating Income Net IncomeCost of Sales Selling, General and
Administrative Expenses
Ratio to net sales
Ratio to net salesRatio to net salesRatio to net sales
(billions of yen) (%) (billions of yen) (%) (billions of yen) (%) (billions of yen) (%)