Sharp 2007 Annual Report Download - page 48
Download and view the complete annual report
Please find page 48 of the 2007 Sharp annual report below. You can navigate through the pages in the report by either clicking on the pages listed below, or by using the keyword search tool below to find specific information within the annual report.-
 1
1 -
2
-
3
-
4
-
5
-
6
-
7
-
8
-
9
-
10
-
11
-
12
-
13
-
14
-
15
-
16
-
17
-
18
-
19
-
20
-
21
-
22
-
23
-
24
-
25
-
26
-
27
-
28
-
29
-
30
-
31
-
32
-
33
-
34
-
35
-
36
-
37
-
 38
38 -
 39
39 -
 40
40 -
 41
41 -
 42
42 -
 43
43 -
 44
44 -
 45
45 -
 46
46 -
 47
47 -
 48
48 -
 49
49 -
 50
50 -
 51
51 -
 52
52 -
 53
53 -
 54
54 -
 55
55 -
 56
56 -
 57
57 -
 58
58 -
59
-
60
-
61
-
62
-
63
-
64
-
65
-
66
-
67
-
68
 |
 |

46
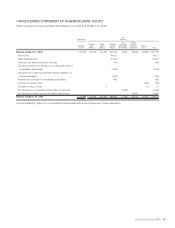
Shareholders’ equity at March 31, 2006 as
previously reported
Reclassification due to adoption of new
accounting standards for presentation of net
assets in the balance sheet at April 1, 2006
Net assets at April 1, 2006
Net income
Cash dividends paid
Directors’ and statutory auditors’ bonuses
Increase resulting from increase in number of
consolidated subsidiaries
Decrease resulting from increase in number of
consolidated subsidiaries
Decrease resulting from change in accounting
standards of consolidated subsidiaries
Increase due to unfunded retirement benefit
obligation of foreign subsidiaries
Purchase of treasury stock
Disposal of treasury stock
Net changes in items other than owners’ equity
Balance at March 31, 2007
1,749,367
1,749,367
1,749,367
2,241,778
2,241,778
60
2,241,838
5,715,274
5,715,274
869,376
(223,761)
(4,000)
16,026
(3,658)
(24,154)
24,205
6,369,308
(225,479)
(225,479)
(4,102)
145
(229,436)
239,248
239,248
(30,863)
208,385
—
—
8
8
(327,795)
(327,795)
100,521
(227,274)
9,392,393
74,650
9,467,043
869,376
(223,761)
(4,000)
16,026
(3,658)
(24,154)
24,205
(4,102)
205
72,606
10,189,786
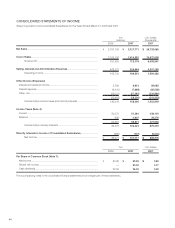
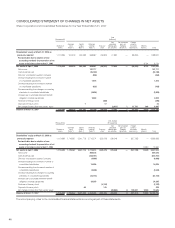
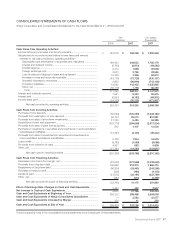
The accompanying notes to the consolidated financial statements are an integral part of these statements.
U.S. dollars
(thousands)
Common
stock
(Note 7)
Capital
surplus
(Note 7)
Retained
earnings
(Note 7)
Treasury
stock
Net
unrealized
holding gains
on securities
Net unrealized
gains on
hedging
derivatives
Foreign
currency
translation
adjustments
—
74,650
74,650
2,940
77,590
Minority
interests Total
Shareholders’ equity at March 31, 2006 as
previously reported
Reclassification due to adoption of new
accounting standards for presentation of net
assets in the balance sheet at April 1, 2006
Net assets at April 1, 2006
Net income
Cash dividends paid
Directors’ and statutory auditors’ bonuses
Increase resulting from increase in number
of consolidated subsidiaries
Decrease resulting from increase in number
of consolidated subsidiaries
Decrease resulting from change in accounting
standards of consolidated subsidiaries
Increase due to unfunded retirement benefit
obligation of foreign subsidiaries
Purchase of treasury stock
Disposal of treasury stock
Net changes in items other than owners’ equity
Balance at March 31, 2007
204,676
204,676
204,676
262,288
262,288
7
262,295
668,687
668,687
101,717
(26,180)
(468)
1,875
(428)
(2,826)
2,832
745,209
(26,381)
(26,381)
(480)
17
(26,844)
27,992
27,992
(3,611)
24,381
—
—
1
1
(38,352)
(38,352)
11,761
(26,591)
1,098,910
8,734
1,107,644
101,717
(26,180)
(468)
1,875
(428)
(2,826)
2,832
(480)
24
8,495
1,192,205
Yen
(millions)(thousands)
Common
stock
(Note 7)
1,110,699
1,110,699
1,110,699
Number of
shares
Capital
surplus
(Note 7)
Retained
earnings
(Note 7)
Treasury
stock
Net
unrealized
holding gains
on securities
Net unrealized
gains on
hedging
derivatives
Foreign
currency
translation
adjustments
—
8,734
8,734
344
9,078
Minority
interests Total
(thousands)
1,110,699
1,110,699
1,110,699
Number of
shares
CONSOLIDATED STATEMENT OF CHANGES IN NET ASSETS
Sharp Corporation and Consolidated Subsidiaries for the Year Ended March 31, 2007