Sharp 2007 Annual Report Download - page 4
Download and view the complete annual report
Please find page 4 of the 2007 Sharp annual report below. You can navigate through the pages in the report by either clicking on the pages listed below, or by using the keyword search tool below to find specific information within the annual report.-
 1
1 -
 2
2 -
 3
3 -
 4
4 -
 5
5 -
 6
6 -
 7
7 -
 8
8 -
 9
9 -
 10
10 -
 11
11 -
 12
12 -
 13
13 -
 14
14 -
 15
15 -
16
-
17
-
18
-
19
-
20
-
21
-
22
-
23
-
24
-
25
-
26
-
27
-
28
-
29
-
30
-
31
-
32
-
33
-
34
-
35
-
36
-
37
-
38
-
39
-
40
-
41
-
42
-
43
-
44
-
45
-
46
-
47
-
48
-
49
-
50
-
51
-
52
-
53
-
54
-
55
-
56
-
57
-
58
-
59
-
60
-
61
-
62
-
63
-
64
-
65
-
66
-
67
-
68
 |
 |

02
Yen
(millions)
U.S. Dollars
(thousands)
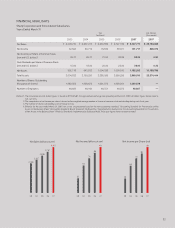
(Notes) 1. The translation into U.S. dollar figures is based on ¥117=U.S.$1, the approximate exchange rate prevailing on March 31, 2007. All dollar figures herein refer to
U.S. currency.
2. The computation of net income per share is based on the weighted average number of shares of common stock outstanding during each fiscal year.
3. The number of shares outstanding is net of treasury stock.
4. Effective for the year ended March 31, 2007, net assets are presented based on the new accounting standard, “Accounting Standard for Presentation of Net
Assets in the Balance Sheet” (Accounting Standards Board Statement No.5) and the “Implementation Guidance for the Accounting Standard for Presentation
of Net Assets in the Balance Sheet” (Financial Standards Implementation Guidance No.8). Prior year figures have not been restated.
200720072006200520042003
Net Sales
Net Income
Net Income per Share of Common Stock
(yen and U.S. dollars)
Cash Dividends per Share of Common Stock
(yen and U.S. dollars)
Net Assets
Total Assets
Number of Shares Outstanding
(thousands of shares)
Number of Employees
$ 26,733,085
869,376
0.80
0.22
10,189,786
25,374,444
—
—
¥ 3,127,771
101,717
93.25
26.00
1,192,205
2,968,810
1,090,678
48,927
¥ 2,797,109
88,671
80.85
22.00
1,098,910
2,560,299
1,090,901
46,872
¥ 2,539,859
76,845
70.04
20.00
1,004,326
2,385,026
1,091,075
46,751
¥ 2,257,273
60,715
55.37
18.00
943,532
2,150,250
1,090,672
46,164
¥ 2,003,210
32,594
29.37
15.00
902,116
2,004,832
1,089,855
46,633
FINANCIAL HIGHLIGHTS
Sharp Corporation and Consolidated Subsidiaries
Years Ended March 31
Net Sales (billions of yen) Net Income (billions of yen) Net Income per Share (yen)
03 04 05 06 07
2,003
2,257
2,539
2,797
3,127 101 93
03 04 05 06 07
32
60
76
88
03 04 05 06 07
29
55
70
80