Sharp 2007 Annual Report Download - page 43
Download and view the complete annual report
Please find page 43 of the 2007 Sharp annual report below. You can navigate through the pages in the report by either clicking on the pages listed below, or by using the keyword search tool below to find specific information within the annual report.-
 1
1 -
2
-
3
-
4
-
5
-
6
-
7
-
8
-
9
-
10
-
11
-
12
-
13
-
14
-
15
-
16
-
17
-
18
-
19
-
20
-
21
-
22
-
23
-
24
-
25
-
26
-
27
-
28
-
29
-
30
-
31
-
32
-
 33
33 -
 34
34 -
 35
35 -
 36
36 -
 37
37 -
 38
38 -
 39
39 -
 40
40 -
 41
41 -
 42
42 -
 43
43 -
 44
44 -
 45
45 -
 46
46 -
 47
47 -
 48
48 -
 49
49 -
 50
50 -
 51
51 -
 52
52 -
 53
53 -
54
-
55
-
56
-
57
-
58
-
59
-
60
-
61
-
62
-
63
-
64
-
65
-
66
-
67
-
68
 |
 |

Sharp Annual Report 2007 41
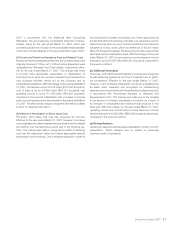
0
10
20
30
40
50
03 04 05 0706
42.9
39.9
45.0 43.9
42.1
03 04 05 0706
902
943
1,004
1,098
1,192
0
200
400
600
800
1,000
1,200
03 04 05 0706
522
601
501
441
525
0
100
200
300
400
500
600
03 04 05 0706
299
271 277
295
0
60
120
180
240
300
360
329
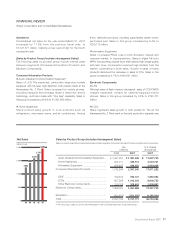
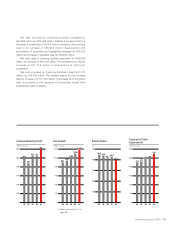
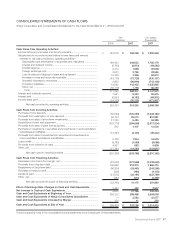
Net cash provided by operating activities increased by
¥50,599 million to ¥314,352 million. Despite a turnaround from a
decrease in inventories of ¥2,693 million recorded in the previous
year to an increase of ¥86,946 million, depreciation and
amortization of properties and intangibles increased by ¥22,198
million and increase in payables was up ¥89,480 million.
Net cash used in investing activities amounted to ¥328,789
million, an increase of ¥99,403 million. The primary factor was an
increase of ¥61,778 million in acquisitions of plant and
equipment.
Net cash provided by financing activities totaled ¥41,170
million, up ¥74,930 million. The primary reason for this increase
was an increase of ¥112,782 million in proceeds from long-term
debt due mainly to the issuance of convertible bonds with
subscription rights to shares.
*Refer to footnote (*1) on
page 36
Equity Ratio
Net Assets
*
Interest-Bearing Debt Cash and Cash
Equivalents
(billions of yen) (billions of yen) (billions of yen)(%)