Sharp 2007 Annual Report Download - page 62
Download and view the complete annual report
Please find page 62 of the 2007 Sharp annual report below. You can navigate through the pages in the report by either clicking on the pages listed below, or by using the keyword search tool below to find specific information within the annual report.-
 1
1 -
2
-
3
-
4
-
5
-
6
-
7
-
8
-
9
-
10
-
11
-
12
-
13
-
14
-
15
-
16
-
17
-
18
-
19
-
20
-
21
-
22
-
23
-
24
-
25
-
26
-
27
-
28
-
29
-
30
-
31
-
32
-
33
-
34
-
35
-
36
-
37
-
38
-
39
-
40
-
41
-
42
-
43
-
44
-
45
-
46
-
47
-
48
-
49
-
50
-
51
-
 52
52 -
 53
53 -
 54
54 -
 55
55 -
 56
56 -
 57
57 -
 58
58 -
 59
59 -
 60
60 -
 61
61 -
 62
62 -
 63
63 -
 64
64 -
 65
65 -
 66
66 -
 67
67 -
 68
68
 |
 |

60
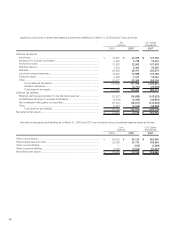
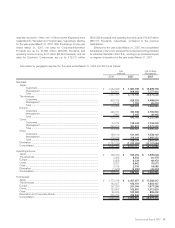
Net Sales:
Consumer/Information Products:
Customers..............................................................................................
Intersegment ..........................................................................................
Total .......................................................................................................
Electronic Components:
Customers..............................................................................................
Intersegment ..........................................................................................
Total .......................................................................................................
Elimination .....................................................................................................
Consolidated .................................................................................................
Operating Income:
Consumer/Information Products....................................................................
Electronic Components .................................................................................
Elimination .....................................................................................................
Consolidated .................................................................................................
Total Assets:
Consumer/Information Products....................................................................
Electronic Components .................................................................................
Elimination and Corporate Assets ..................................................................
Consolidated .................................................................................................
Depreciation and Amortization:
Consumer/Information Products....................................................................
Electronic Components .................................................................................
Elimination .....................................................................................................
Consolidated .................................................................................................
Capital Expenditures:
Consumer/Information Products....................................................................
Electronic Components .................................................................................
Elimination .....................................................................................................
Consolidated .................................................................................................
$ 17,590,675
80,607
17,671,282
9,142,410
4,205,333
13,347,743
(4,285,940)
$ 26,733,085
$ 698,333
901,872
(5,923)
$ 1,594,282
$ 7,925,820
13,538,162
3,910,462
$ 25,374,444
$ 397,949
1,479,299
(16,436)
$ 1,860,812
$ 610,932
2,465,008
(23,949)
$ 3,051,991
¥ 2,058,109
9,431
2,067,540
1,069,662
492,024
1,561,686
(501,455)
¥ 3,127,771
¥ 81,705
105,519
(693)
¥ 186,531
¥ 927,321
1,583,965
457,524
¥ 2,968,810
¥ 46,560
173,078
(1,923)
¥ 217,715
¥ 71,479
288,406
(2,802)
¥ 357,083
¥ 1,736,763
6,086
1,742,849
1,060,346
297,724
1,358,070
(303,810)
¥ 2,797,109
¥ 62,299
101,914
(503)
¥ 163,710
¥ 775,684
1,352,124
432,491
¥ 2,560,299
¥ 38,314
155,629
(829)
¥ 193,114
¥ 63,355
226,678
(2,468)
¥ 287,565
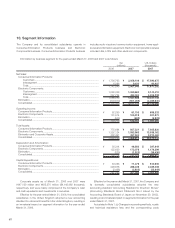
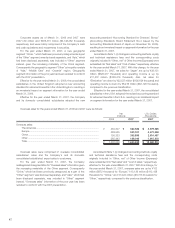
Corporate assets as of March 31, 2006 and 2007 were
¥447,139 million and ¥485,370 million ($4,148,462 thousand),
respectively, and were mainly comprised of the Company’s cash
and cash equivalents and investments in securities.
Effective for the year ended March 31, 2006, the consolidated
subsidiaries in the United Kingdom adopted a new accounting
standard for retirement benefits in the United Kingdom, resulting in
an immaterial impact on segment information for the year ended
March 31, 2006.
Effective for the year ended March 31, 2007, the Company and
its domestic consolidated subsidiaries adopted the new
accounting standard “Accounting Standard for Directors’ Bonus”
(Accounting Standards Board Statement No.4 issued by the
Accounting Standards Board of Japan on November 29, 2005),
resulting in an immaterial impact on segment information for the year
ended March 31, 2007.
As is stated in Note 1. (o) Changes in accounting methods, royalty
and technical assistance fees and the corresponding costs
200720072006
Yen
(millions) U.S. Dollars
(thousands)
The Company and its consolidated subsidiaries operate in
Consumer/Information Products business and Electronic
Components business. Consumer/Information Products business
includes audio-visual and communication equipment, home appli-
ances and information equipment. Electronic Components business
includes LSIs, LCDs and other electronic components.
10. Segment Information
Information by business segment for the years ended March 31, 2006 and 2007 is as follows: