Salesforce.com 2011 Annual Report Download - page 73
Download and view the complete annual report
Please find page 73 of the 2011 Salesforce.com annual report below. You can navigate through the pages in the report by either clicking on the pages listed below, or by using the keyword search tool below to find specific information within the annual report.-
 1
1 -
2
-
3
-
4
-
5
-
6
-
7
-
8
-
9
-
10
-
11
-
12
-
13
-
14
-
15
-
16
-
17
-
18
-
19
-
20
-
21
-
22
-
23
-
24
-
25
-
26
-
27
-
28
-
29
-
30
-
31
-
32
-
33
-
34
-
35
-
36
-
37
-
38
-
39
-
40
-
41
-
42
-
43
-
44
-
45
-
46
-
47
-
48
-
49
-
50
-
51
-
52
-
53
-
54
-
55
-
56
-
57
-
58
-
59
-
60
-
61
-
62
-
 63
63 -
 64
64 -
 65
65 -
 66
66 -
 67
67 -
 68
68 -
 69
69 -
 70
70 -
 71
71 -
 72
72 -
 73
73 -
 74
74 -
 75
75 -
 76
76 -
 77
77 -
 78
78 -
 79
79 -
 80
80 -
 81
81 -
 82
82 -
 83
83 -
84
-
85
-
86
-
87
-
88
-
89
-
90
-
91
-
92
-
93
-
94
-
95
-
96
-
97
-
98
-
99
-
100
-
101
-
102
-
103
-
104
-
105
-
106
-
107
-
108
 |
 |

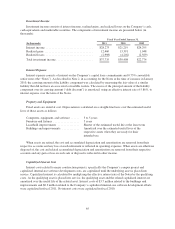
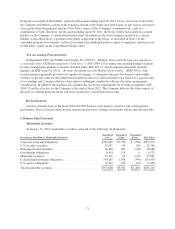
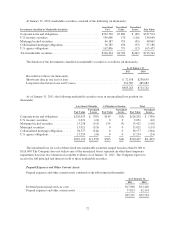
Investment Income
Investment income consists of interest income, realized gains, and realized losses on the Company’s cash,
cash equivalents and marketable securities. The components of investment income are presented below (in
thousands):
Fiscal Year Ended January 31,
(In thousands) 2011 2010 2009
Interest income ................................ $28,273 $21,219 $24,295
Realized gains ................................. 12,460 13,391 1,048
Realized losses ................................ (2,998) (4,202) (2,569)
Total investment income ......................... $37,735 $30,408 $22,774
Interest Expense
Interest expense consists of interest on the Company’s capital lease commitments and 0.75% convertible
senior notes (the “Notes”). As described in Note 2, in accounting for the Notes at the time of issuance in January
2010, the carrying amount of the liability component was calculated by measuring the fair value of a similar
liability that did not have an associated convertible feature. The excess of the principal amount of the liability
component over its carrying amount (“debt discount”) is amortized, using an effective interest rate of 5.86%, to
interest expense over the term of the Notes.
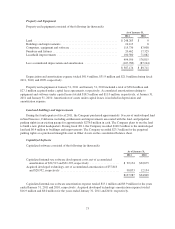
Property and Equipment
Fixed assets are stated at cost. Depreciation is calculated on a straight-line basis over the estimated useful
lives of those assets as follows:
Computers, equipment, and software ...... 3to5years
Furniture and fixtures .................. 5years
Leasehold improvements ............... Shorter of the estimated useful life or the lease term
Buildings and improvements ............ Amortized over the estimated useful lives of the
respective assets when they are ready for their
intended use.
When assets are retired, the cost and accumulated depreciation and amortization are removed from their
respective accounts and any loss on such retirement is reflected in operating expenses. When assets are otherwise
disposed of, the cost and related accumulated depreciation and amortization are removed from their respective
accounts and any gain or loss on such sale or disposal is reflected in other income.
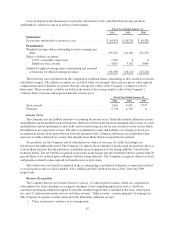
Capitalized Interest Cost
Interest costs related to major construction projects, specifically the Company’s campus project and
capitalized internal-use software development costs, are capitalized until the underlying asset is placed into
service. Capitalized interest is calculated by multiplying the effective interest rate of the Notes by the qualifying
costs. As the qualifying asset is placed into service, the qualifying asset and the related capitalized interest are
amortized over the useful life of the related asset. Interest costs of $3.7 million related to the buildings and
improvements and $0.3 million related to the Company’s capitalized internal-use software development efforts
were capitalized in fiscal 2011. No interest costs were capitalized in fiscal 2010.
65