Salesforce.com 2011 Annual Report Download - page 48
Download and view the complete annual report
Please find page 48 of the 2011 Salesforce.com annual report below. You can navigate through the pages in the report by either clicking on the pages listed below, or by using the keyword search tool below to find specific information within the annual report.-
 1
1 -
2
-
3
-
4
-
5
-
6
-
7
-
8
-
9
-
10
-
11
-
12
-
13
-
14
-
15
-
16
-
17
-
18
-
19
-
20
-
21
-
22
-
23
-
24
-
25
-
26
-
27
-
28
-
29
-
30
-
31
-
32
-
33
-
34
-
35
-
36
-
37
-
 38
38 -
 39
39 -
 40
40 -
 41
41 -
 42
42 -
 43
43 -
 44
44 -
 45
45 -
 46
46 -
 47
47 -
 48
48 -
 49
49 -
 50
50 -
 51
51 -
 52
52 -
 53
53 -
 54
54 -
 55
55 -
 56
56 -
 57
57 -
 58
58 -
59
-
60
-
61
-
62
-
63
-
64
-
65
-
66
-
67
-
68
-
69
-
70
-
71
-
72
-
73
-
74
-
75
-
76
-
77
-
78
-
79
-
80
-
81
-
82
-
83
-
84
-
85
-
86
-
87
-
88
-
89
-
90
-
91
-
92
-
93
-
94
-
95
-
96
-
97
-
98
-
99
-
100
-
101
-
102
-
103
-
104
-
105
-
106
-
107
-
108
 |
 |

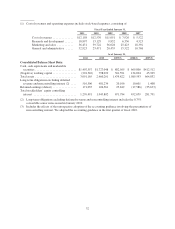
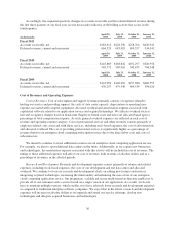
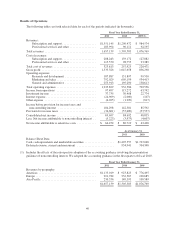
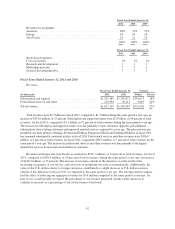
Results of Operations
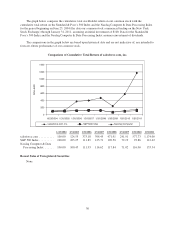
The following tables set forth selected data for each of the periods indicated (in thousands).
Fiscal Year Ended January 31,
2011 2010 2009 (1)
Revenues:
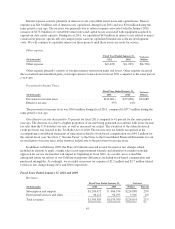
Subscription and support ....................... $1,551,145 $1,209,472 $ 984,574
Professional services and other .................. 105,994 96,111 92,195
Total revenues ................................... 1,657,139 1,305,583 1,076,769
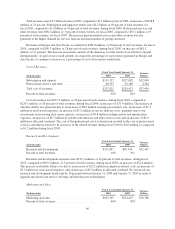
Cost of revenues:
Subscription and support ....................... 208,243 159,172 127,082
Professional services and other .................. 115,570 98,753 93,389
Total cost of revenues ............................. 323,813 257,925 220,471
Gross profit ..................................... 1,333,326 1,047,658 856,298
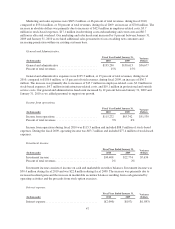
Operating expenses:
Research and development ..................... 187,887 131,897 99,530
Marketing and sales ........................... 792,029 605,199 534,413
General and administrative ..................... 255,913 195,290 158,613
Total operating expenses ........................... 1,235,829 932,386 792,556
Income from operations ........................... 97,497 115,272 63,742
Investment income ............................... 37,735 30,408 22,774
Interest expense .................................. (24,909) (2,000) (107)
Other expense ................................... (6,025) (1,299) (817)
Income before provision for income taxes and
noncontrolling interest .......................... 104,298 142,381 85,592
Provision for income taxes ......................... (34,601) (57,689) (37,557)
Consolidated net income ........................... 69,697 84,692 48,035
Less: Net income attributable to noncontrolling interest . . (5,223) (3,973) (4,607)
Net income attributable to salesforce.com ............. $ 64,474 $ 80,719 $ 43,428
As of January 31,
2011 2010
Balance Sheet Data:
Cash, cash equivalents and marketable securities .................... $1,407,557 $1,727,048
Deferred revenue, current and noncurrent ......................... 934,941 704,348
(1) Includes the effects of the retrospective adoption of the accounting guidance involving the presentation
guidance of noncontrolling interest. We adopted the accounting guidance in the first quarter of fiscal 2010.
Fiscal Year Ended January 31,
2011 2010 2009
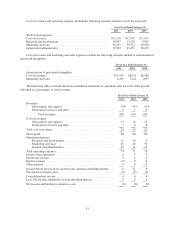
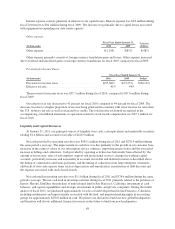
Revenues by geography:
Americas ....................................... $1,135,019 $ 923,823 $ 776,495
Europe ......................................... 291,784 232,367 190,685
Asia Pacific ..................................... 230,336 149,393 109,589
$1,657,139 $1,305,583 $1,076,769
40