Salesforce.com 2011 Annual Report Download - page 53
Download and view the complete annual report
Please find page 53 of the 2011 Salesforce.com annual report below. You can navigate through the pages in the report by either clicking on the pages listed below, or by using the keyword search tool below to find specific information within the annual report.-
 1
1 -
2
-
3
-
4
-
5
-
6
-
7
-
8
-
9
-
10
-
11
-
12
-
13
-
14
-
15
-
16
-
17
-
18
-
19
-
20
-
21
-
22
-
23
-
24
-
25
-
26
-
27
-
28
-
29
-
30
-
31
-
32
-
33
-
34
-
35
-
36
-
37
-
38
-
39
-
40
-
41
-
42
-
 43
43 -
 44
44 -
 45
45 -
 46
46 -
 47
47 -
 48
48 -
 49
49 -
 50
50 -
 51
51 -
 52
52 -
 53
53 -
 54
54 -
 55
55 -
 56
56 -
 57
57 -
 58
58 -
 59
59 -
 60
60 -
 61
61 -
 62
62 -
 63
63 -
64
-
65
-
66
-
67
-
68
-
69
-
70
-
71
-
72
-
73
-
74
-
75
-
76
-
77
-
78
-
79
-
80
-
81
-
82
-
83
-
84
-
85
-
86
-
87
-
88
-
89
-
90
-
91
-
92
-
93
-
94
-
95
-
96
-
97
-
98
-
99
-
100
-
101
-
102
-
103
-
104
-
105
-
106
-
107
-
108
 |
 |

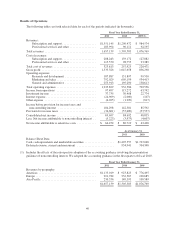
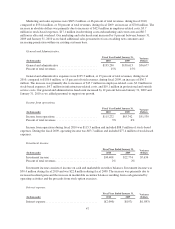
Interest expense consists primarily of interest on our convertible senior notes and capital leases. Interest
expense was $24.9 million, net of interest costs capitalized, during fiscal 2011 and was $2.0 million during the
same period a year ago. The increase was primarily due to interest expense associated with the January 2010
issuance of $575.0 million of convertible senior notes and capital leases associated with equipment acquired to
expand our data center capacity. During fiscal 2011, we capitalized $4.0 million of interest costs related to major
construction projects, specifically our campus project and our capitalized internal-use software development
costs. We will continue to capitalize interest on these projects until these assets are ready for service.
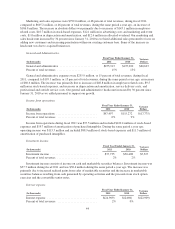
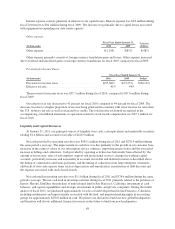
Other expense.
Fiscal Year Ended January 31, Variance
Dollars(In thousands) 2011 2010
Other expense ..................................... $(6,025) $(1,299) $(4,726)
Other expense primarily consists of foreign currency transaction gains and losses. Other expense increased
due to realized and unrealized gains on foreign currency transactions for fiscal 2011 compared to the same period
a year ago.
Provision for Income Taxes.
Fiscal Year Ended January 31, Variance
Dollars(In thousands) 2011 2010
Provision for income taxes .......................... $(34,601) $(57,689) $23,088
Effective tax rate .................................. 33% 41%
The provision for income taxes was $34.6 million during fiscal 2011, compared to $57.7 million during the
same period a year ago.
Our effective tax rate decreased to 33 percent for fiscal 2011 compared to 41 percent for the same period a
year ago. The decrease was due to a higher proportion of income being generated in countries with lower income
tax rates than the U.S statutory tax rate, as well as increased tax credits. The extension of the federal research
credit provision was enacted in the Tax Relief Act of 2010. The total income tax benefit recognized in the
accompanying consolidated statements of operations related to stock-based compensation was $44.1 million for
the current fiscal year. See Note 7 “Income Taxes” to the Notes to the Consolidated Financial Statements for our
reconciliation of income taxes at the statutory federal rate to the provision for income taxes.
In addition, in February 2009, the State of California enacted several income tax law changes which
included an election to apply a single sales factor apportionment formula and adoption of a market sourcing
approach for service income that will impact us beginning in fiscal 2012. As a result, we re-valued the
anticipated future tax effects of our California temporary differences including stock-based compensation and
purchased intangibles. Accordingly, we recorded an income tax expense of $2.2 million and $2.7 million related
to this tax law change during 2011 and 2010 respectively.
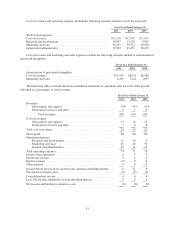
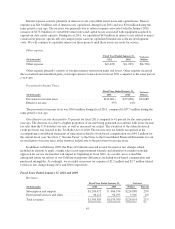
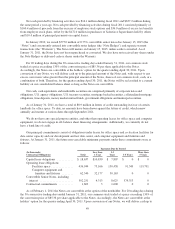
Fiscal Years Ended January 31, 2010 and 2009
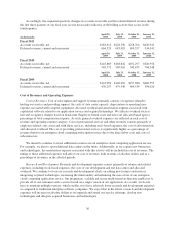
Revenues.
(In thousands)
Fiscal Year Ended January 31, Variance
2010 2009 Dollars Percent
Subscription and support .................. $1,209,472 $ 984,574 $224,898 23%
Professional services and other ............. 96,111 92,195 3,916 4%
Total revenues .......................... $1,305,583 $1,076,769 $228,814 21%
45