Salesforce.com 2011 Annual Report Download - page 51
Download and view the complete annual report
Please find page 51 of the 2011 Salesforce.com annual report below. You can navigate through the pages in the report by either clicking on the pages listed below, or by using the keyword search tool below to find specific information within the annual report.-
 1
1 -
2
-
3
-
4
-
5
-
6
-
7
-
8
-
9
-
10
-
11
-
12
-
13
-
14
-
15
-
16
-
17
-
18
-
19
-
20
-
21
-
22
-
23
-
24
-
25
-
26
-
27
-
28
-
29
-
30
-
31
-
32
-
33
-
34
-
35
-
36
-
37
-
38
-
39
-
40
-
 41
41 -
 42
42 -
 43
43 -
 44
44 -
 45
45 -
 46
46 -
 47
47 -
 48
48 -
 49
49 -
 50
50 -
 51
51 -
 52
52 -
 53
53 -
 54
54 -
 55
55 -
 56
56 -
 57
57 -
 58
58 -
 59
59 -
 60
60 -
 61
61 -
62
-
63
-
64
-
65
-
66
-
67
-
68
-
69
-
70
-
71
-
72
-
73
-
74
-
75
-
76
-
77
-
78
-
79
-
80
-
81
-
82
-
83
-
84
-
85
-
86
-
87
-
88
-
89
-
90
-
91
-
92
-
93
-
94
-
95
-
96
-
97
-
98
-
99
-
100
-
101
-
102
-
103
-
104
-
105
-
106
-
107
-
108
 |
 |

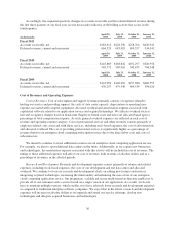
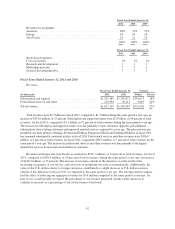
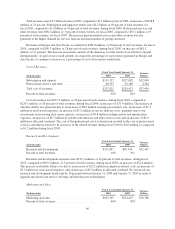
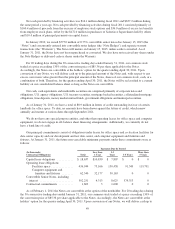
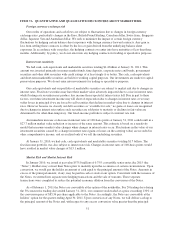
Cost of Revenues.
Fiscal Year Ended January 31, Variance
Dollars(In thousands) 2011 2010
Subscription and support ....................................... $208,243 $159,172 $49,071
Professional services and other .................................. 115,570 98,753 16,817
Total cost of revenues ......................................... $323,813 $257,925 $65,888
Percent of total revenues ....................................... 20% 20%
Cost of revenues was $323.8 million, or 20 percent of total revenues, during fiscal 2011, compared to
$257.9 million, or 20 percent of total revenues, during the same period a year ago, an increase of $65.9 million.
The increase in absolute dollars was primarily due to an increase of $22.6 million in employee-related costs, an
increase of $9.2 million in service delivery costs, primarily due to our efforts in increasing data center capacity,
an increase of $16.6 million in depreciation and amortization expenses, an increase of $13.2 million in outside
subcontractor and other service costs, and an increase of $3.6 million in allocated overhead, offset by a decrease
of $0.4 million in stock based expenses. The cost of professional services and other revenues exceeded the
related revenue during fiscal 2011 by $9.6 million as compared to $2.6 million during fiscal 2010, primarily due
to an increase in the cost related to professional services headcount.
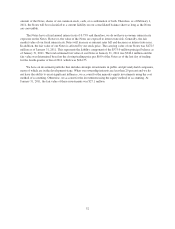
We intend to continue to invest additional resources in our enterprise cloud computing application service.
The timing of these additional expenses, will affect our cost of revenues, both in terms of absolute dollars and as
a percentage of revenues in future periods.
We expect the cost of professional services to continue to exceed revenue from professional services during
fiscal 2012. We believe that this investment in professional services facilitates the adoption of our application
service.
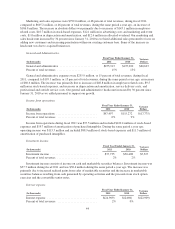
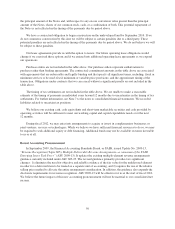
Research and Development.
Fiscal Year Ended January 31, Variance
Dollars(In thousands) 2011 2010
Research and development .......................... $187,887 $131,897 $55,990
Percent of total revenues ............................ 11% 10%
Research and development expenses were $187.9 million, or 11 percent of total revenues, during fiscal
2011, compared to $131.9 million, or 10 percent of total revenues, during the same period a year ago, an increase
of $56.0 million. The increase in absolute dollars was due to an increase of $42.0 million in employee-related
costs, an increase of $5.8 million in stock-based expenses, and an increase of $5.6 million in allocated overhead.
We increased our research and development headcount by 47 percent since January 31, 2010 in order to upgrade
and extend our service offerings and develop new technologies. Some of the increase in headcount was due to
acquired businesses.
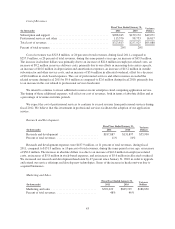
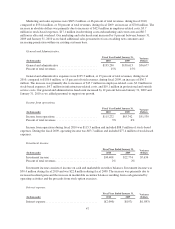
Marketing and Sales.
Fiscal Year Ended January 31, Variance
Dollars(In thousands) 2011 2010
Marketing and sales ............................... $792,029 $605,199 $186,830
Percent of total revenues ........................... 48% 46%
43