Porsche 2006 Annual Report Download - page 154
Download and view the complete annual report
Please find page 154 of the 2006 Porsche annual report below. You can navigate through the pages in the report by either clicking on the pages listed below, or by using the keyword search tool below to find specific information within the annual report.-
 1
1 -
2
-
3
-
4
-
5
-
6
-
7
-
8
-
9
-
10
-
11
-
12
-
13
-
14
-
15
-
16
-
17
-
18
-
19
-
20
-
21
-
22
-
23
-
24
-
25
-
26
-
27
-
28
-
29
-
30
-
31
-
32
-
33
-
34
-
35
-
36
-
37
-
38
-
39
-
40
-
41
-
42
-
43
-
44
-
45
-
46
-
47
-
48
-
49
-
50
-
51
-
52
-
53
-
54
-
55
-
56
-
57
-
58
-
59
-
60
-
61
-
62
-
63
-
64
-
65
-
66
-
67
-
68
-
69
-
70
-
71
-
72
-
73
-
74
-
75
-
76
-
77
-
78
-
79
-
80
-
81
-
82
-
83
-
84
-
85
-
86
-
87
-
88
-
89
-
90
-
91
-
92
-
93
-
94
-
95
-
96
-
97
-
98
-
99
-
100
-
101
-
102
-
103
-
104
-
105
-
106
-
107
-
108
-
109
-
110
-
111
-
112
-
113
-
114
-
115
-
116
-
117
-
118
-
119
-
120
-
121
-
122
-
123
-
124
-
125
-
126
-
127
-
128
-
129
-
130
-
131
-
132
-
133
-
134
-
135
-
136
-
137
-
138
-
139
-
140
-
141
-
142
-
143
-
 144
144 -
 145
145 -
 146
146 -
 147
147 -
 148
148 -
 149
149 -
 150
150 -
 151
151 -
 152
152 -
 153
153 -
 154
154 -
 155
155 -
 156
156 -
 157
157 -
 158
158 -
 159
159 -
 160
160 -
 161
161 -
 162
162 -
 163
163 -
 164
164 -
165
-
166
-
167
-
168
-
169
-
170
-
171
-
172
-
173
-
174
-
175
-
176
-
177
-
178
-
179
-
180
-
181
-
182
-
183
-
184
-
185
-
186
-
187
-
188
-
189
-
190
 |
 |

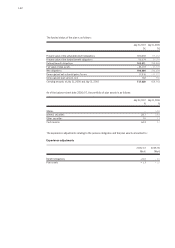
152
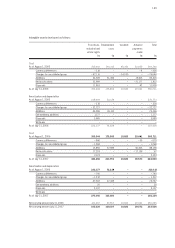
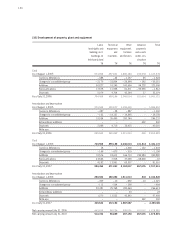
Leased Total
assets fixed
assets
T€ T€
Cost
As of August 1, 2005 1,357,824 5,076,697
Currency differences – 56,484 – 58,434
Changes to consolidated group – – 131,861
Additions 551,948 4,744,996
Reclassifications ––
Disposals 533,097 597,078
As of July 31, 2006 1,320,191 9,034,320
Amortization and depreciation
As of August 1, 2005 390,717 2,648,347
Currency differences – 15,166 – 16,686
Changes to consolidated group – – 61,885
Additions 164,801 486,434
Extraordinary additions – 522,337
Disposals 180,811 225,012
Write-ups ––
As of July 31, 2006 359,541 3,353,535
Cost
As of August 1, 2006 1,320,191 9,034,320
Currency differences – 77,930 – 80,208
Changes to consolidated group – – 2,426
Additions 625,724 4,519,424
Reclassifications ––
Disposals 535,160 618,802
As of July 31, 2007 1,332,825 12,852,308
Amortization and depreciation
As of August 1, 2006 359,541 3,353,535
Currency differences – 20,212 – 21,973
Changes to consolidated group – – 2,116
Additions 182,893 524,253
Extraordinary additions – 43
Disposals 180,376 240,141
Write-ups – 521,150
As of July 31, 2007 341,846 3,092,451
Net carrying amount July 31, 2006 960,650 5,680,785
Net carrying amount July 31, 2007 990,979 9,759,857
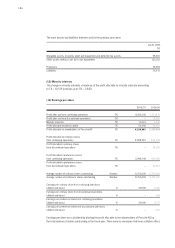
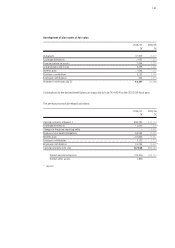
(18) Development of leased assets and of total non-current assets