Porsche 2006 Annual Report Download - page 151
Download and view the complete annual report
Please find page 151 of the 2006 Porsche annual report below. You can navigate through the pages in the report by either clicking on the pages listed below, or by using the keyword search tool below to find specific information within the annual report.-
 1
1 -
2
-
3
-
4
-
5
-
6
-
7
-
8
-
9
-
10
-
11
-
12
-
13
-
14
-
15
-
16
-
17
-
18
-
19
-
20
-
21
-
22
-
23
-
24
-
25
-
26
-
27
-
28
-
29
-
30
-
31
-
32
-
33
-
34
-
35
-
36
-
37
-
38
-
39
-
40
-
41
-
42
-
43
-
44
-
45
-
46
-
47
-
48
-
49
-
50
-
51
-
52
-
53
-
54
-
55
-
56
-
57
-
58
-
59
-
60
-
61
-
62
-
63
-
64
-
65
-
66
-
67
-
68
-
69
-
70
-
71
-
72
-
73
-
74
-
75
-
76
-
77
-
78
-
79
-
80
-
81
-
82
-
83
-
84
-
85
-
86
-
87
-
88
-
89
-
90
-
91
-
92
-
93
-
94
-
95
-
96
-
97
-
98
-
99
-
100
-
101
-
102
-
103
-
104
-
105
-
106
-
107
-
108
-
109
-
110
-
111
-
112
-
113
-
114
-
115
-
116
-
117
-
118
-
119
-
120
-
121
-
122
-
123
-
124
-
125
-
126
-
127
-
128
-
129
-
130
-
131
-
132
-
133
-
134
-
135
-
136
-
137
-
138
-
139
-
140
-
 141
141 -
 142
142 -
 143
143 -
 144
144 -
 145
145 -
 146
146 -
 147
147 -
 148
148 -
 149
149 -
 150
150 -
 151
151 -
 152
152 -
 153
153 -
 154
154 -
 155
155 -
 156
156 -
 157
157 -
 158
158 -
 159
159 -
 160
160 -
 161
161 -
162
-
163
-
164
-
165
-
166
-
167
-
168
-
169
-
170
-
171
-
172
-
173
-
174
-
175
-
176
-
177
-
178
-
179
-
180
-
181
-
182
-
183
-
184
-
185
-
186
-
187
-
188
-
189
-
190
 |
 |

149
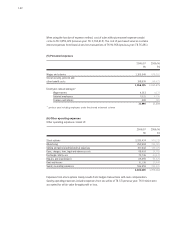
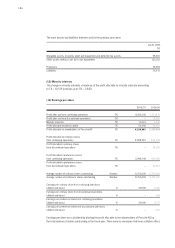
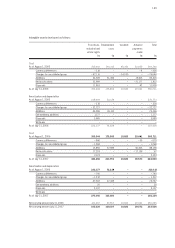
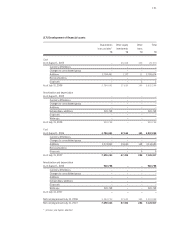
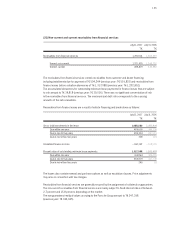
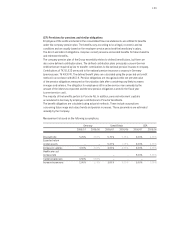
Franchises, Development Goodwill Advance Total
industrial and costs payments
similar rights made
T€ T€ T€ T€ T€
Cost
As of August 1, 2005 352,643 144,312 45,350 22,055 564,360
Currency differences – 318 – – – 8 – 326
Changes to consolidated group – 42,116 – – 34,530 – – 76,646
Additions 32,309 31,494 – 19,613 83,416
Reclassifications 22,989 – – – 21,177 1,812
Disposals 11,863 – – 42 11,905
As of July 31, 2006 353,644 175,806 10,820 20,441 560,711
Amortization and depreciation
As of August 1, 2005 218,644 52,129 – – 270,773
Currency differences – 218 – – – – 218
Changes to consolidated group – 32,727 – – – – 32,727
Additions 49,286 26,110 – – 75,396
Extraordinary additions 1,177 – – – 1,177
Disposals 3,985 – – – 3,985
Write-ups – – – – –
As of July 31, 2006 232,177 78,239 – – 310,416
Cost
As of August 1, 2006 353,644 175,806 10,820 20,441 560,711
Currency differences – 840 – – – 35 – 875
Changes to consolidated group – 1,268 – – – – 1,268
Additions 13,850 37,985 – 36,303 88,138
Reclassifications 17,203 – – – 17,136 67
Disposals 2,123 – – – 2,123
As of July 31, 2007 380,466 213,791 10,820 39,573 644,650
Amortization and depreciation
As of August 1, 2006 232,177 78,239 – – 310,416
Currency differences – 740 – – – – 740
Changes to consolidated group – 1,212 – – – – 1,212
Additions 47,302 27,445 – – 74,747
Extraordinary additions 20 – – – 20
Disposals 2,107 – – – 2,107
Write-ups – – – – –
As of July 31, 2007 275,440 105,684 – – 381,124
Net carrying amount July 31, 2006 121,467 97,567 10,820 20,441 250,295
Net carrying amount July 31, 2007 105,026 108,107 10,820 39,573 263,526
Intangible assets developed as follows: