Office Depot 2003 Annual Report Download - page 89
Download and view the complete annual report
Please find page 89 of the 2003 Office Depot annual report below. You can navigate through the pages in the report by either clicking on the pages listed below, or by using the keyword search tool below to find specific information within the annual report.-
 1
1 -
2
-
3
-
4
-
5
-
6
-
7
-
8
-
9
-
10
-
11
-
12
-
13
-
14
-
15
-
16
-
17
-
18
-
19
-
20
-
21
-
22
-
23
-
24
-
25
-
26
-
27
-
28
-
29
-
30
-
31
-
32
-
33
-
34
-
35
-
36
-
37
-
38
-
39
-
40
-
41
-
42
-
43
-
44
-
45
-
46
-
47
-
48
-
49
-
50
-
51
-
52
-
53
-
54
-
55
-
56
-
57
-
58
-
59
-
60
-
61
-
62
-
63
-
64
-
65
-
66
-
67
-
68
-
69
-
70
-
71
-
72
-
73
-
74
-
75
-
76
-
77
-
78
-
 79
79 -
 80
80 -
 81
81 -
 82
82 -
 83
83 -
 84
84 -
 85
85 -
 86
86 -
 87
87 -
 88
88 -
 89
89 -
 90
90 -
 91
91 -
 92
92 -
 93
93 -
 94
94 -
 95
95 -
 96
96 -
 97
97 -
 98
98 -
 99
99 -
100
-
101
-
102
-
103
-
104
-
105
-
106
-
107
-
108
 |
 |

87 Office Depot 2003 / Proxy Statement
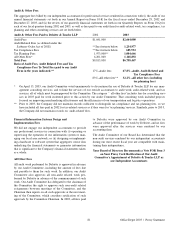
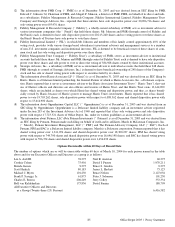
Option Grants In Last Fiscal Year
The following table sets forth information with respect to all options granted in fiscal 2003 to the Named Executive Officers.
Percentage of
Number of total Options Exercise
Securities Granted to or Base Grant Date
Underlying Employees Price Grant Expiration Present
NAME Options in Year ($/share) Date Date Value(1) ($)
Nelson 200,000 3.52% 11.485 2/14/2003 2/14/2013 902,860
375,000(2) 6.60% 11.485 2/14/2003 2/14/2010 1,692,863
Colley 75,000 1.32% 11.485 2/14/2003 2/14/2013 338,573
75,000(2) 1.32% 11.485 2/14/2003 2/14/2010 338,573
Van Kaldekerken 75,000 1.32% 11.485 2/14/2003 2/14/2013 338,573
75,000(2) 1.32% 11.485 2/14/2003 2/14/2010 338,573
Brown 40,000 0.33% 11.485 2/14/2003 2/14/2013 180,572
18,750(2) 0.70% 11.485 2/14/2003 2/14/2010 84,643
Fannin 40,000 0.33% 11.485 2/14/2003 2/14/2013 180,572
18,750(2) 0.70% 11.485 2/14/2003 2/14/2010 84,643
(1) The Black-Scholes option-pricing model was used to determine the grant date present value of the stock options granted in
2003 by the Company to the persons listed above. The hypothetical values shown were calculated based upon the following
assumptions: For all, the volatility rate is equal to 40%, and the dividend yield (representing the current per-share annualized
dividends divided by the annualized fair market value of the common stock) is equal to 0%. The risk-free interest rate is
3.2%, based on the interest rate of a U.S. Treasury zero-coupon bond on the date of grant, with a maturity corresponding
to the estimated time until exercise. The values do not take into account risk factors such as non-transferability or risk of
forfeiture.
(2) Indicates “ performance-accelerated stock options,” which have a longer vesting schedule than traditional stock options,
unless certain performance parameters by our Company are achieved, in which event these options can vest earlier than their
scheduled vesting date.
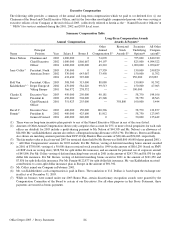
Aggregated Option Exercises In Last Fiscal Year And Fiscal Year-End Option Values
The following table shows you information about all options exercised by our Named Executive Officers in fiscal 2003 and the
year-end value of unexercised options held by our Named Executive Officers.
Number of Value of
Securities Unexercised
Underlying In-The-Money
Unexercised Options at
Options at Fiscal
Fiscal Year-End Year-End(1)
Shares
Acquired on Value
Name Exercise (#) Realized($) (#) Exercisable (#) Unexercisable ($) Exercisable ($) Unexercisable
Nelson 0 0 1,982,854 1,791,668 8,684,314 2,707,047
Colley 66,666 486,328 100,000 383,334 217,250 1,948,255
Van Kaldekerken 129,166 910,015 92,502 270,834 13,556 867,317
Brown 100,833 896,541 162,916 118,751 153,972 432,506
Fannin 34,617 361,659 137,466 102,084 476,105 387,005
(1) In accordance with SEC rules, values are calculated by subtracting the exercise price from the fair market value of the under-
lying common stock. For the purpose of calculating the values in this table, the fair market value is deemed to be $16.52 per
share, the average of the high and low prices reported for NYSE transactions on December 26, 2003. The “ Value of
Unexercised, In-the-Money Options at Fiscal Year-end,” unlike figures in the “ Value Realized” column, has not been, and
may never be realized. The actual gain, if any, on exercise, will depend upon the value of the Company’s common stock on
the date of such exercise.