Office Depot 2003 Annual Report Download - page 19
Download and view the complete annual report
Please find page 19 of the 2003 Office Depot annual report below. You can navigate through the pages in the report by either clicking on the pages listed below, or by using the keyword search tool below to find specific information within the annual report.-
 1
1 -
2
-
3
-
4
-
5
-
6
-
7
-
8
-
 9
9 -
 10
10 -
 11
11 -
 12
12 -
 13
13 -
 14
14 -
 15
15 -
 16
16 -
 17
17 -
 18
18 -
 19
19 -
 20
20 -
 21
21 -
 22
22 -
 23
23 -
 24
24 -
 25
25 -
 26
26 -
 27
27 -
 28
28 -
 29
29 -
30
-
31
-
32
-
33
-
34
-
35
-
36
-
37
-
38
-
39
-
40
-
41
-
42
-
43
-
44
-
45
-
46
-
47
-
48
-
49
-
50
-
51
-
52
-
53
-
54
-
55
-
56
-
57
-
58
-
59
-
60
-
61
-
62
-
63
-
64
-
65
-
66
-
67
-
68
-
69
-
70
-
71
-
72
-
73
-
74
-
75
-
76
-
77
-
78
-
79
-
80
-
81
-
82
-
83
-
84
-
85
-
86
-
87
-
88
-
89
-
90
-
91
-
92
-
93
-
94
-
95
-
96
-
97
-
98
-
99
-
100
-
101
-
102
-
103
-
104
-
105
-
106
-
107
-
108
 |
 |

Item 7. Management’s Discussion and Analysis of
Financial Condition and Results of Operations.
Results of Operations
General
Office Depot, Inc., together with our subsidiaries, (“ Office
Depot”or the “ Company”) is a global supplier of office prod-
ucts and services. We sell to consumers and businesses of all
sizes through our three business segments: North American
Retail Division, Business Services Group, and International
Division. Our management views our overall business in
the context of the performances of these three principal busi-
ness segments.
These segments include multiple sales channels consisting
of office supply stores, a contract sales force, Internet sites,
and catalog and call centers, all supported by our crossdock,
warehouse and delivery operations. Each of these segments is
described in more detail in Item 1, Business Section, of this
Annual Report on Form 10-K. We operate on a 52- or
53-week fiscal year ending on the last Saturday in December.
All years in the discussion below contained 52 weeks.
In June 2003, we expanded our contract business in
Europe with our acquisition of Guilbert, a leading contract
stationer. Guilbert sells to small, medium and large companies
in France, the UK, Germany, Italy, Ireland, the Netherlands,
Spain, Belgium and Portugal through a direct sales force and
through e-commerce and other Internet solutions, under the
Guilbert威 and NiceDay娃brand names. The results of Guilbert
are included in our International Division since the date of
acquisition.
Forward-Looking Statements
This Management’s Discussion and Analysis of Financial
Condition and Results of Operations (“ MD&A”) is intended
to provide information to assist you in better understanding
our business. We recommend that you read this MD&A in
conjunction with our Consolidated Financial Statements and
the Notes to those statements. This MD&A contains signifi-
cant amounts of forward-looking information, and is qualified
by our Cautionary Statements regarding forward-looking
information. You will find Cautionary Statements throughout
this MD&A; however, most of them can be found in a separate
section immediately following this MD&A. Without limitation,
wherever in this Annual Report we use the words “ believe,”
“ estimate,”“ plan,”“ expect,”“ intend,”“ anticipate,”“ continue,”
“ project,”“ should,”and similar expressions, we are identifying
forward-looking statements, and our Cautionary Statements
apply to these terms and expressions and the text in which
such terms and expressions are used. The purposes of this
MD&A include providing to the reader the perspectives of
management as we view the business, and providing to you
insights that are not necessarily obvious or clear from reading
our financial statements (including footnotes) alone.
17 Office Depot 2003 / Form 10-K
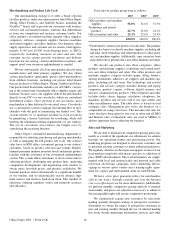
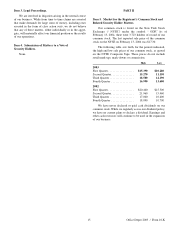
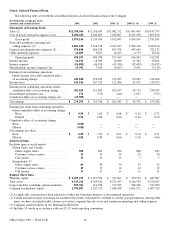
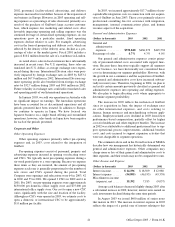
Overall
(Dollars in millions) 2003 2002 2001
Sales . . . . . . . . . . . . . . . . . . . . . . . . . . . . . . $12,358.6 100.0% $11,356.6 100.0% $11,082.1 100.0%
Cost of goods sold and occupancy costs. . . 8,484.5 68.7% 8,022.7 70.6% 7,940.1 71.6%
Gross profit . . . . . . . . . . . . . . . . . . . . . 3,874.1 31.3% 3,333.9 29.4% 3,142.0 28.4%
Store and warehouse operating and
selling expenses. . . . . . . . . . . . . . . . . . . . 2,802.2 22.7% 2,338.1 20.6% 2,331.0 21.1%
Segment operating profit. . . . . . . . . . . . . . . 1,071.9 8.6% 995.8 8.8% 811.0 7.3%
General and administrative expenses . . . . . 578.8 4.7% 486.3 4.3% 445.5 4.0%
Other operating expenses . . . . . . . . . . . . . . 22.8 0.1% 9.8 0.1% 12.1 0.1%
Operating profit . . . . . . . . . . . . . . . . . . . . . . $ 470.3 3.8% $ 499.7 4.4% $ 353.4 3.2%
Our overall sales increased 9% in 2003 after an increase
of 2% in 2002. The increase in sales in both periods is attribut-
able to increased sales from our International Division and our
Business Services Group, partially offset by declining sales in
our North American Retail Division. Positively impacting
sales in our International Division during 2003 was our acqui-
sition of Guilbert in June, which contributed additional sales of
$808.8 million, the impact of changes to foreign currency
rates, and the growth in our existing contract business. Our
management believes that the acquisition of Guilbert has
added significantly to our capability and future business
prospects in Europe. Our BSG segment experienced increased
sales as a result of expanding our contract business, partially
offset by weaker catalog sales. Worldwide e-commerce sales
have improved in all periods, increasing to $2.6 billion in
2003 from $2.1 billion in 2002.
Comparable sales measure the sales from operations or
stores that have been in existence or open for one year or more
and is used throughout the MD&A to understand the relative
trends in our business. From time to time we regroup product
categories to conform more closely to the way that we manage
the business. Accordingly, certain comparable sales product
amounts reported in prior periods have been adjusted to con-
form to current year classification. From a comparable sales
perspective, total Company sales declined 2% in 2003 and
were flat in 2002, primarily as a result of negative comparable
sales in our North American Retail Division of –4% and –2%,
respectively. The decline in comparable sales in the North
American Retail Division primarily reflects a decrease in
sales of our technology and furniture products.