Office Depot 2003 Annual Report Download - page 51
Download and view the complete annual report
Please find page 51 of the 2003 Office Depot annual report below. You can navigate through the pages in the report by either clicking on the pages listed below, or by using the keyword search tool below to find specific information within the annual report.-
 1
1 -
2
-
3
-
4
-
5
-
6
-
7
-
8
-
9
-
10
-
11
-
12
-
13
-
14
-
15
-
16
-
17
-
18
-
19
-
20
-
21
-
22
-
23
-
24
-
25
-
26
-
27
-
28
-
29
-
30
-
31
-
32
-
33
-
34
-
35
-
36
-
37
-
38
-
39
-
40
-
 41
41 -
 42
42 -
 43
43 -
 44
44 -
 45
45 -
 46
46 -
 47
47 -
 48
48 -
 49
49 -
 50
50 -
 51
51 -
 52
52 -
 53
53 -
 54
54 -
 55
55 -
 56
56 -
 57
57 -
 58
58 -
 59
59 -
 60
60 -
 61
61 -
62
-
63
-
64
-
65
-
66
-
67
-
68
-
69
-
70
-
71
-
72
-
73
-
74
-
75
-
76
-
77
-
78
-
79
-
80
-
81
-
82
-
83
-
84
-
85
-
86
-
87
-
88
-
89
-
90
-
91
-
92
-
93
-
94
-
95
-
96
-
97
-
98
-
99
-
100
-
101
-
102
-
103
-
104
-
105
-
106
-
107
-
108
 |
 |

OFFICE DEPOT, INC.
NOTES TO CONSOLIDATED FINANCIAL STATEMENTS (Continued)
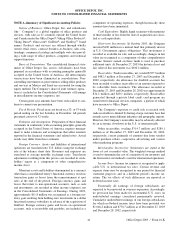
Guarantee of Private Label Credit Card Receivables:
Office Depot has private label credit card programs that are
managed by a third-party financial services company. The
Company acts as the guarantor of all loans between our com-
mercial customers and the financial services company. The
difference between the transfer amount and the amount
received is recognized in store and warehouse operating and
selling expense. Maximum exposure to off-balance sheet
credit risk is represented by the outstanding balance of private
label credit card receivables, less reserves held by the finan-
cial services company which are funded by us. At December
27, 2003, the transferred amount totaled approximately
$263.4 million. The fair value liability associated with risk of
loss is included in accrued expenses.
Other: We are involved in litigation arising in the normal
course of business. In our opinion, these matters will not mate-
rially affect our financial position or results of operations.
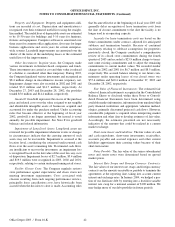
NOTE J—Employee Benefit Plans
Long-Term Equity Incentive Plan
The Long-Term Equity Incentive Plan, which was approved
by the Company’s stockholders, became effective October 1,
1997. This plan provides for the grants of stock options and
other incentive awards, including restricted stock, to directors,
officers and key employees. Under this plan, stock options
must be granted at an option price that is greater than or equal
to the market price of the stock on the date of the grant. If an
employee owns at least 10% of the Company’s outstanding
common stock, the option price must be at least 110% of the
market price on the date of the grant. Options granted under
this plan become exercisable from one to five years after the
date of grant, provided that the individual is continuously
employed with the Company. All options granted expire no
more than 10 years following the date of grant.
To date under this plan, 391,193 shares of restricted stock
were issued at no cost to the employees, 68,565 of which have
been canceled and 140,000 remain outstanding but restricted.
The fair market value of these awards was approximately $5.0
million at the date of the grants. Restricted stock issued under
this plan may have vesting periods of up to four years from
the date of grant. Compensation expense is recognized on a
straight-line basis over the vesting period.
In April 2002, stockholders approved an amendment to
the plan allowing the Compensation Committee of the Board
of Directors to grant performance-based shares to our senior
executives and directors. Performance-based shares are used
as an incentive to increase shareholder returns with actual
awards based on the Company’s Total Shareholder Return
over a three-year period, compared against the industry peer
group. Compensation expense for the anticipated number of
shares to be issued, if any, will be recognized over the vesting
period. Depending on actual Company performance, shares
issued may be more or less than amounts assigned. As of
December 27, 2003, target awards of 244,250 shares have been
assigned, but no performance-based shares have been issued.
Tax benefits are recorded based on an estimate of stock
options activity. Each year, the prior year’s estimated tax ben-
efit is adjusted based on the actual stock sold during the year.
Tax benefits received in excess of compensation expense
recorded on nonqualified stock options are credited to addi-
tional paid-in capital.
Long-Term Incentive Stock Plan
Prior to our merger with Viking Office Products (“ Viking”)
in 1998, Viking’s Long-Term Incentive Stock Plan allowed
awards of up to 2,400,000 restricted shares of common stock to
key Viking employees. Under this plan, 1,845,000 shares were
issued at no cost to employees, of which 1,395,000 have been
canceled or the restrictions satisfied, leaving 450,000 restricted
shares outstanding. Pursuant to the merger agreement, shares
issued under this plan were converted to Office Depot com-
mon stock, and no additional shares may be issued under the
plan. The fair market value of these restricted stock awards
was approximately $10.0 million at the date of the grants.
Prior to the merger, the vesting period was 15 years. Because
of the plan’s change in control provision, however, the
employees now vest in their stock ratably over the 15-year
period. Compensation expense is recognized on a straight-line
basis over the vesting period.
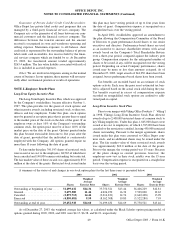
A summary of the status of and changes in our stock option plans for the last three years is presented below.
2003 2002 2001
Weighted Weighted Weighted
Average Average Average
Shares Exercise Price Shares Exercise Price Shares Exercise Price
Outstanding at beginning of year . . . . . 31,499,632 $14.36 35,750,521 $13.46 36,406,229 $12.81
Granted . . . . . . . . . . . . . . . . . . . . . . . . . 5,679,500 11.46 6,926,250 16.39 7,509,000 10.63
Canceled . . . . . . . . . . . . . . . . . . . . . . . . (2,875,713) 14.44 (3,014,831) 14.74 (2,642,428) 13.99
Exercised . . . . . . . . . . . . . . . . . . . . . . . (4,850,481) 9.50 (8,162,308) 10.80 (5,522,280) 7.93
Outstanding at end of year . . . . . . . . . . 29,452,938 $14.60 31,499,632 $14.69 35,750,521 $13.46
As of December 27, 2003, the weighted average fair values, as calculated under the Black Scholes option pricing model, of
options granted during 2003, 2002, and 2001 were $4.17, $6.38, and $4.21, respectively.
49 Office Depot 2003 / Form 10-K