Office Depot 2003 Annual Report Download - page 7
Download and view the complete annual report
Please find page 7 of the 2003 Office Depot annual report below. You can navigate through the pages in the report by either clicking on the pages listed below, or by using the keyword search tool below to find specific information within the annual report.-
 1
1 -
 2
2 -
 3
3 -
 4
4 -
 5
5 -
 6
6 -
 7
7 -
 8
8 -
 9
9 -
 10
10 -
 11
11 -
 12
12 -
 13
13 -
 14
14 -
 15
15 -
 16
16 -
 17
17 -
 18
18 -
19
-
20
-
21
-
22
-
23
-
24
-
25
-
26
-
27
-
28
-
29
-
30
-
31
-
32
-
33
-
34
-
35
-
36
-
37
-
38
-
39
-
40
-
41
-
42
-
43
-
44
-
45
-
46
-
47
-
48
-
49
-
50
-
51
-
52
-
53
-
54
-
55
-
56
-
57
-
58
-
59
-
60
-
61
-
62
-
63
-
64
-
65
-
66
-
67
-
68
-
69
-
70
-
71
-
72
-
73
-
74
-
75
-
76
-
77
-
78
-
79
-
80
-
81
-
82
-
83
-
84
-
85
-
86
-
87
-
88
-
89
-
90
-
91
-
92
-
93
-
94
-
95
-
96
-
97
-
98
-
99
-
100
-
101
-
102
-
103
-
104
-
105
-
106
-
107
-
108
 |
 |

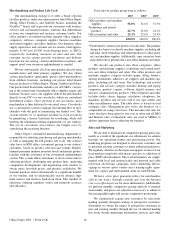
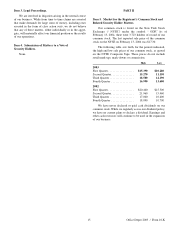
QUARTERLY STOCK PRICE RANGE
The following table sets forth, for the periods indicated, the high and low sales prices of the Company’s common stock quoted on the
NYSE Composite Tape. These prices do not include retail mark-ups, mark-downs or commissions:
2003 High Low
First Quarter $15.390 $10.280
Second Quarter $15.270 $11.150
Third Quarter $18.500 $14.190
Fourth Quarter $16.990 $13.600
2002 High Low
First Quarter $20.400 $15.500
Second Quarter $21.960 $15.460
Third Quarter $17.000 $10.600
Fourth Quarter $18.090 $10.700
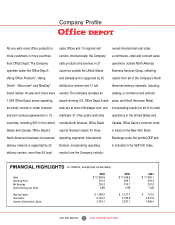
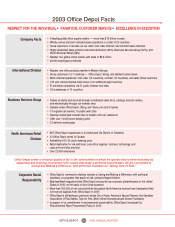
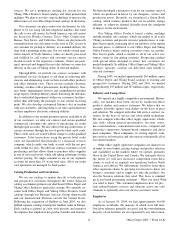
FINANCIAL HIGHLIGHTS
OFFICE DEPOT 2003 ANNUAL REPORT
5
The following table sets forth the consolidated historical selected financial data of the Company:
(In thousands, except per share
amounts and statistical data) 2003 2002 2001 (1) 2000 (1) (4) 1999 (1)
Statements of Earnings Data:
Sales (2). . . . . . . . . . . . . . . . . . . . . . . . . . . . . . . . . . . . . . . $12,358,566 $11,356,633 $11,082,112 $11,495,493 $10,197,373
Cost of goods sold and occupancy costs . . . . . . . . . . . . . . 8,484,420 8,022,663 7,940,067 8,435,928 7,405,870
Gross profit . . . . . . . . . . . . . . . . . . . . . . . . . . . . . . . . 3,874,146 3,333,970 3,142,045 3,059,565 2,791,503
Store and warehouse operating and
selling expenses (2) . . . . . . . . . . . . . . . . . . . . . . . . . . . . 2,802,240 2,338,128 2,331,013 2,498,146 2,040,216
General and administrative expenses (2) . . . . . . . . . . . . . . 578,840 486,279 445,538 447,693 322,172
Other operating expenses. . . . . . . . . . . . . . . . . . . . . . . . . . 22,809 9,855 12,125 6,733 16,524
Operating profit . . . . . . . . . . . . . . . . . . . . . . . . . . . . . 470,257 499,708 353,369 106,993 412,591
Interest income . . . . . . . . . . . . . . . . . . . . . . . . . . . . . . . . . 14,196 18,509 12,980 11,345 30,043
Interest expense. . . . . . . . . . . . . . . . . . . . . . . . . . . . . . . . . (54,805) (46,195) (43,339) (32,683) (24,852)
Miscellaneous income (expense), net . . . . . . . . . . . . . . . . . 15,392 7,183 (9,057) 4,632 (3,514)
Earnings from continuing operations
before income taxes and cumulative effect
of accounting change. . . . . . . . . . . . . . . . . . . . . . . . . . . 445,040 479,205 313,953 90,287 414,268
Income taxes . . . . . . . . . . . . . . . . . . . . . . . . . . . . . . . . . . . 143,016 167,722 112,296 41,972 155,875
Earnings from continuing operations before
cumulative effect of accounting change . . . . . . . . . . . . . 302,024 311,483 201,657 48,315 258,393
Discontinued operations, net . . . . . . . . . . . . . . . . . . . . . . . 176 (775) (614) 1,017 (755)
Cumulative effect of accounting change, net . . . . . . . . . . . (25,905) — — ——
Net earnings . . . . . . . . . . . . . . . . . . . . . . . . . . . . . . . . . . . $ 276,295 $ 310,708 $ 201,043 $ 49,332 $ 257,638
Earnings per share from continuing operations
before cumulative effect of accounting change:
Basic . . . . . . . . . . . . . . . . . . . . . . . . . . . . . . . . . . . . . $0.98$1.02$0.68 $ 0.16 $ 0.72
Diluted . . . . . . . . . . . . . . . . . . . . . . . . . . . . . . . . . . . . 0.96 0.98 0.66 0.16 0.69
Cumulative effect of accounting change:
Basic . . . . . . . . . . . . . . . . . . . . . . . . . . . . . . . . . . . . . . . (0.08) — — ——
Diluted . . . . . . . . . . . . . . . . . . . . . . . . . . . . . . . . . . . . . . (0.08) — — ——
Net earnings per share: . . . . . . . . . . . . . . . . . . . . . . . . . . .
Basic . . . . . . . . . . . . . . . . . . . . . . . . . . . . . . . . . . . . . . . $0.89$1.01$0.67 $ 0.16 $ 0.71
Diluted . . . . . . . . . . . . . . . . . . . . . . . . . . . . . . . . . . . . . . 0.88 0.98 0.66 0.16 0.69
Statistical Data:
Facilities open at end of period:
United States and Canada:
Office supply stores . . . . . . . . . . . . . . . . . . . . . . . . . . 900 867 859 888 825
Customer service centers. . . . . . . . . . . . . . . . . . . . . . 22 24 24 25 30
Call centers . . . . . . . . . . . . . . . . . . . . . . . . . . . . . . . . 13 13 13 7 7
International (3):
Office supply stores . . . . . . . . . . . . . . . . . . . . . . . . . . 64 50 39 35 32
Customer service centers . . . . . . . . . . . . . . . . . . . . . 25 15 14 12 12
Call centers . . . . . . . . . . . . . . . . . . . . . . . . . . . . . . . . 31 13 11 11 11
Balance Sheet Data:
Working capital . . . . . . . . . . . . . . . . . . . . . . . . . . . . . . . . . $1,299,475 $1,217,706 $ 721,867 $ 790,752 $ 687,007
Total assets . . . . . . . . . . . . . . . . . . . . . . . . . . . . . . . . . . . . 6,145,242 4,765,812 4,331,643 4,196,334 4,276,183
Long-term debt, excluding current maturities. . . . . . . . . . . 829,302 411,970 317,552 598,499 321,099
Common stockholders’ equity . . . . . . . . . . . . . . . . . . . . . . 2,794,087 2,297,112 1,848,438 1,601,251 1,907,720
(1) As applicable, amounts have been adjusted to reflect the Australian business as discontinued operations.
(2) Certain amounts in prior year financial statements have been reclassified to conform to current year presentation. Among other items, we have classified facility closure costs
from a separate line into store and warehouse operating and selling expenses.
(3) Company-owned facilities in our International Division.
(4) Includes 53 weeks in accordance with our 52–53 week reporting convention.