NVIDIA 2009 Annual Report Download - page 68
Download and view the complete annual report
Please find page 68 of the 2009 NVIDIA annual report below. You can navigate through the pages in the report by either clicking on the pages listed below, or by using the keyword search tool below to find specific information within the annual report.-
 1
1 -
2
-
3
-
4
-
5
-
6
-
7
-
8
-
9
-
10
-
11
-
12
-
13
-
14
-
15
-
16
-
17
-
18
-
19
-
20
-
21
-
22
-
23
-
24
-
25
-
26
-
27
-
28
-
29
-
30
-
31
-
32
-
33
-
34
-
35
-
36
-
37
-
38
-
39
-
40
-
41
-
42
-
43
-
44
-
45
-
46
-
47
-
48
-
49
-
50
-
51
-
52
-
53
-
54
-
55
-
56
-
57
-
 58
58 -
 59
59 -
 60
60 -
 61
61 -
 62
62 -
 63
63 -
 64
64 -
 65
65 -
 66
66 -
 67
67 -
 68
68 -
 69
69 -
 70
70 -
 71
71 -
 72
72 -
 73
73 -
 74
74 -
 75
75 -
 76
76 -
 77
77 -
 78
78 -
79
-
80
-
81
-
82
-
83
-
84
-
85
-
86
-
87
-
88
-
89
-
90
-
91
-
92
-
93
-
94
-
95
-
96
-
97
-
98
-
99
-
100
-
101
-
102
-
103
-
104
-
105
-
106
-
107
-
108
-
109
-
110
-
111
-
112
-
113
-
114
-
115
-
116
-
117
-
118
-
119
-
120
-
121
-
122
-
123
-
124
-
125
-
126
-
127
-
128
-
129
-
130
-
131
-
132
-
133
-
134
-
135
-
136
-
137
-
138
-
139
-
140
-
141
 |
 |

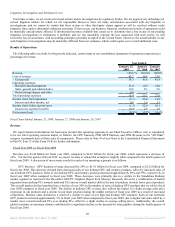
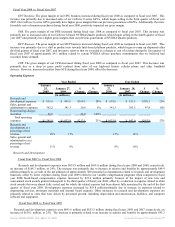
Operating activities
Operating activities generated cash of $249.4 million, $1.27 billion and $572.7 million during fiscal years 2009, 2008 and 2007,
respectively. The cash provided by operating activities decreased in fiscal year 2009 due to a decrease in our net income compared to
fiscal year 2008 plus the impact of non-cash charges to earnings and deferred income taxes. During fiscal year 2009, non-cash
charges to earnings included stock-based compensation of $162.7 million and depreciation and amortization on our long-term assets of
$185.0 million. Additionally, operating cash flows for fiscal year 2009 also declined due to changes in operating assets and liabilities,
including the timing of payments to vendors and a decrease in inventory turnover. Additionally, we incurred $21.8 million in net cash
outflows in fiscal year 2009 towards a confidential patent licensing agreement that we entered into in fiscal year 2007.
The increase in cash flows from operating activities in fiscal year 2008 when compared to fiscal year 2007 was primarily due to
an increase in our net income during the comparable periods plus the impact of non-cash charges to earnings. During fiscal year 2008,
non-cash charges to earnings included stock-based compensation of $133.4 million and depreciation and amortization on our
long-term assets of $133.2 million. Additionally, operating cash flows for fiscal year 2008 also improved due to changes in operating
assets and liabilities, including the timing of payments to vendors and an improvement in inventory turnover. These increases were
offset by approximately $57.3 million in net cash outflows towards a confidential patent licensing agreement that we entered into in
fiscal year 2007.
The increase in cash flows from operating activities in fiscal year 2007 when compared to fiscal year 2006 was primarily due to
an increase in our net income during the comparable periods plus the impact of non-cash charges to earnings. Additionally, the
increase is related to the $116.7 million of stock-based compensation expense recorded upon adoption of SFAS No. 123(R) in fiscal
year 2007 and changes in operating assets and liabilities in fiscal years 2007 and 2006.
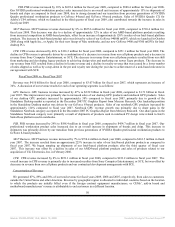
Investing activities
Investing activities have consisted primarily of purchases and sales of marketable securities, acquisition of businesses and purchases
of property and equipment, which include leasehold improvements for our facilities and intangible assets. Investing activities used
cash of $209.4 million, $761.3 million and $526.4 million during fiscal years 2009, 2008 and 2007, respectively. Investing activities
for fiscal year 2009 provided cash of $226.7 million from the net proceeds from sales of marketable securities and used $27.9 million
in connection with our acquisition of Ageia. Investing activities also included $407.7 million cash used for capital expenditures, as we
built additional facilities to accommodate our growing employee headcount, new research and development equipment, testing
equipment to support our increased production requirements, technology licenses, software, intangible assets and leasehold
improvements at our facilities in various international locations. Investing activities for capital expenditures in fiscal year 2009
included payment of approximately $183.8 million for purchase of a property in Santa Clara, California, that includes approximately
25 acres of land and ten commercial buildings. Our original plans for the purchased property included constructing a new campus on
the site. We are currently re-evaluating those plans.
Investing activities for fiscal year 2008 used cash of $496.4 million towards the net purchases of marketable securities,
resulting from the need to invest the additional amounts of cash we received from operating activities, and $75.5 million for our
acquisition of Mental Images. Investing activities for fiscal 2008 also included $187.7 million of capital expenditures. Capital
expenditures included purchase of property in anticipation of building additional facilities to accommodate our growing employee
headcount, new research and development equipment, testing equipment to support our increased production requirements, technology
licenses, software, intangible assets and leasehold improvements at our facilities in various international locations.
In fiscal year 2007, net cash used in investing activities included $401.8 million used for our acquisitions of PortalPlayer, ULi
and Hybrid Graphics. Additionally, net cash used in investing activities included capital expenditures of $130.8 million attributable to
new research and development equipment, hardware equipment, technology licenses, software, intangible assets and leasehold
improvements at our various facilities.
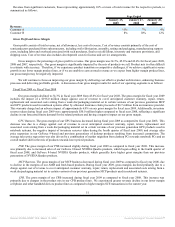
Financing activities
Financing activities used cash of $349.3 million, $326.3 million and $53.6 million during fiscal years 2009, 2008 and 2007,
respectively. Net cash used by financing activities in fiscal year 2009 was primarily due to $423.6 million used in our stock
repurchase program, offset by cash proceeds of $73.5 million from common stock issued under our employee stock plans.
Net cash used by financing activities in fiscal year 2008 was primarily due to $552.5 million used in our stock repurchase
program, offset by cash proceeds of $226.0 million from common stock issued under our employee stock plans.
During fiscal year 2007, net cash used by financing activities towards payments under our stock repurchase program was
$275.0 million. These uses of cash in financing activities were offset by cash proceeds from common stock issued under our employee
stock plans of $221.2 million for fiscal year 2007.
55
Source: NVIDIA CORP, 10-K, March 13, 2009 Powered by Morningstar® Document Research℠