NVIDIA 2009 Annual Report Download - page 123
Download and view the complete annual report
Please find page 123 of the 2009 NVIDIA annual report below. You can navigate through the pages in the report by either clicking on the pages listed below, or by using the keyword search tool below to find specific information within the annual report.-
 1
1 -
2
-
3
-
4
-
5
-
6
-
7
-
8
-
9
-
10
-
11
-
12
-
13
-
14
-
15
-
16
-
17
-
18
-
19
-
20
-
21
-
22
-
23
-
24
-
25
-
26
-
27
-
28
-
29
-
30
-
31
-
32
-
33
-
34
-
35
-
36
-
37
-
38
-
39
-
40
-
41
-
42
-
43
-
44
-
45
-
46
-
47
-
48
-
49
-
50
-
51
-
52
-
53
-
54
-
55
-
56
-
57
-
58
-
59
-
60
-
61
-
62
-
63
-
64
-
65
-
66
-
67
-
68
-
69
-
70
-
71
-
72
-
73
-
74
-
75
-
76
-
77
-
78
-
79
-
80
-
81
-
82
-
83
-
84
-
85
-
86
-
87
-
88
-
89
-
90
-
91
-
92
-
93
-
94
-
95
-
96
-
97
-
98
-
99
-
100
-
101
-
102
-
103
-
104
-
105
-
106
-
107
-
108
-
109
-
110
-
111
-
112
-
 113
113 -
 114
114 -
 115
115 -
 116
116 -
 117
117 -
 118
118 -
 119
119 -
 120
120 -
 121
121 -
 122
122 -
 123
123 -
 124
124 -
 125
125 -
 126
126 -
 127
127 -
 128
128 -
 129
129 -
 130
130 -
 131
131 -
 132
132 -
 133
133 -
134
-
135
-
136
-
137
-
138
-
139
-
140
-
141
 |
 |

NVIDIA CORPORATION AND SUBSIDIARIES
NOTES TO THE CONSOLIDATED FINANCIAL STATEMENTS
(Continued)
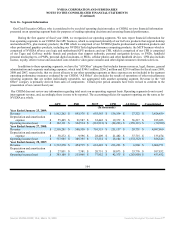
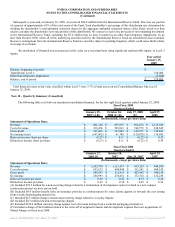
Note 16 - Segment Information
Our Chief Executive Officer, who is considered to be our chief operating decision maker, or CODM, reviews financial information
presented on an operating segment basis for purposes of making operating decisions and assessing financial performance.
During the first quarter of fiscal year 2008, we reorganized our operating segments. We now report financial information for
four operating segments to our CODM: the GPU business, which is comprised primarily of our GeForce products that support desktop
and notebook PCs, plus memory products; the PSB which is comprised of our NVIDIA Quadro professional workstation products and
other professional graphics products, including our NVIDIA Tesla high-performance computing products; the MCP business which is
comprised of NVIDIA nForce core logic and motherboard GPU products; and our CPB, which is comprised of our CPB is comprised
of our Tegra and GoForce mobile brands and products that support netbooks, personal navigation devices, or PNDs, handheld
personal media players, or PMPs, personal digital assistants, or PDAs, cellular phones and other handheld devices. CPB also includes
license, royalty, other revenue and associated costs related to video game consoles and other digital consumer electronics devices.
In addition to these operating segments, we have the “All Other” category that includes human resources, legal, finance, general
administration and corporate marketing expenses, which total $346.1 million, $266.2 million and $239.6 million for fiscal years 2009,
2008 and 2007, respectively, that we do not allocate to our other operating segments as these expenses are not included in the segment
operating performance measures evaluated by our CODM. “All Other” also includes the results of operations of other miscellaneous
reporting segments that are neither individually reportable, nor aggregated with another operating segment. Revenue in the “All
Other” category is primarily derived from sales of components. Certain prior period amounts have been revised to conform to the
presentation of our current fiscal year.
Our CODM does not review any information regarding total assets on an operating segment basis. Operating segments do not record
intersegment revenue, and, accordingly, there is none to be reported. The accounting policies for segment reporting are the same as for
NVIDIA as a whole.
GPU PSB MCP CPB All Other Consolidated
(In thousands)
Year Ended January 25, 2009:
Revenue $ 1,912,262 $ 693,376 $ 655,565 $ 136,334 $ 27,322 $ 3,424,859
Depreciation and amortization
expense $ 55,405 $ 21,587 $ 32,442 $ 19,372 $ 56,217 $ 185,023
Operating income (loss) $ 122,111 $ 322,514 $ (132,921) $ (24,293) $ (358,111) $ (70,700)
Year Ended January 27, 2008:
Revenue $ 2,518,281 $ 588,358 $ 710,353 $ 251,137 $ 29,731 $ 4,097,860
Depreciation and amortization
expense $ 38,272 $ 9,596 $ 28,409 $ 21,482 $ 37,715 $ 135,474
Operating income (loss) $ 717,985 $ 305,395 $ 57,214 $ 28,104 $ (272,352) $ 836,346
Year Ended January 28, 2007:
Revenue $ 1,712,370 $ 454,735 $ 661,483 $ 233,223 $ 6,960 $ 3,068,771
Depreciation and amortization
expense $ 27,851 $ 7,381 $ 20,751 $ 18,073 $ 33,776 $ 107,832
Operating income (loss) $ 383,109 $ 213,966 $ 77,952 $ 42,375 $ (263,950) $ 453,452
104
Source: NVIDIA CORP, 10-K, March 13, 2009 Powered by Morningstar® Document Research℠