NVIDIA 2009 Annual Report Download - page 46
Download and view the complete annual report
Please find page 46 of the 2009 NVIDIA annual report below. You can navigate through the pages in the report by either clicking on the pages listed below, or by using the keyword search tool below to find specific information within the annual report.-
 1
1 -
2
-
3
-
4
-
5
-
6
-
7
-
8
-
9
-
10
-
11
-
12
-
13
-
14
-
15
-
16
-
17
-
18
-
19
-
20
-
21
-
22
-
23
-
24
-
25
-
26
-
27
-
28
-
29
-
30
-
31
-
32
-
33
-
34
-
35
-
 36
36 -
 37
37 -
 38
38 -
 39
39 -
 40
40 -
 41
41 -
 42
42 -
 43
43 -
 44
44 -
 45
45 -
 46
46 -
 47
47 -
 48
48 -
 49
49 -
 50
50 -
 51
51 -
 52
52 -
 53
53 -
 54
54 -
 55
55 -
 56
56 -
57
-
58
-
59
-
60
-
61
-
62
-
63
-
64
-
65
-
66
-
67
-
68
-
69
-
70
-
71
-
72
-
73
-
74
-
75
-
76
-
77
-
78
-
79
-
80
-
81
-
82
-
83
-
84
-
85
-
86
-
87
-
88
-
89
-
90
-
91
-
92
-
93
-
94
-
95
-
96
-
97
-
98
-
99
-
100
-
101
-
102
-
103
-
104
-
105
-
106
-
107
-
108
-
109
-
110
-
111
-
112
-
113
-
114
-
115
-
116
-
117
-
118
-
119
-
120
-
121
-
122
-
123
-
124
-
125
-
126
-
127
-
128
-
129
-
130
-
131
-
132
-
133
-
134
-
135
-
136
-
137
-
138
-
139
-
140
-
141
 |
 |
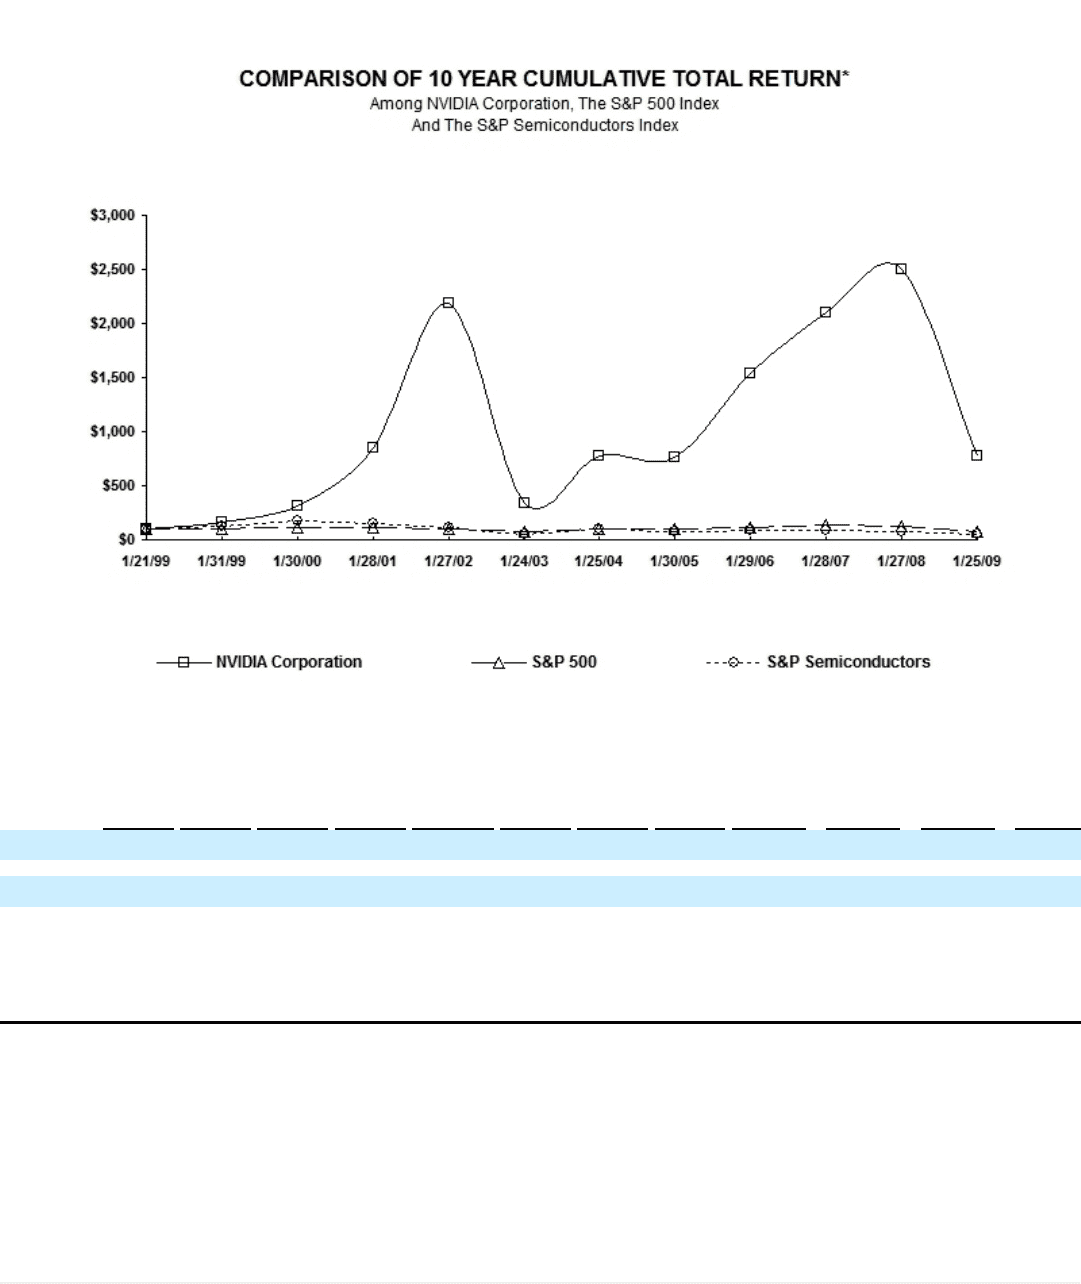
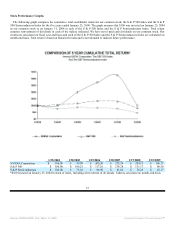
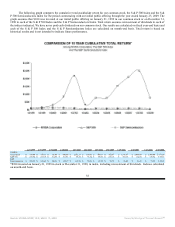
The following graph compares the cumulative total stockholder return for our common stock, the S & P 500 Index and the S &
P 500 Semiconductors Index for the period commencing with our initial public offering through the year ended January 25, 2009. The
graph assumes that $100 was invested at our initial public offering on January 21, 1999 in our common stock or on December 31,
1998 in each of the S & P 500 Index and the S & P Semiconductors Index. Total return assumes reinvestment of dividends in each of
the indices indicated. We have never paid cash dividends on our common stock. Our results are calculated on fiscal year-end basis and
each of the S & P 500 Index and the S & P Semiconductors Index are calculated on month-end basis. Total return is based on
historical results and is not intended to indicate future performance.
1/21/1999 1/31/1999 1/30/2000 1/28/2001 1/27/2002 1/24/2003 1/25/2004 1/30/2005 1/29/2006 1/28/2007 1/27/2008 1/25/2009
NVIDIA
Corporation $ 100.00 $ 158.33 $ 311.46 $ 846.88 $ 2,182.33 $ 339.00 $ 769.67 $ 762.67
$ 1,541.67 $ 2,098.00 $ 2,495.00 $ 771.00
S&P 500 $ 100.00 $ 104.18 $ 114.96 $ 113.93 $ 95.53 $ 73.54 $ 98.97 $ 105.13 $ 116.05 $ 132.89 $ 129.82 $ 79.67
S&P
Semiconductors $ 100.00 $ 119.64 $ 180.33 $ 145.17 $ 112.96 $ 50.00 $ 99.52 $ 74.79
$ 86.48 $ 81.43 $ 75.88 $ 45.49
*$100 invested on January 21, 1999 in stock or December 31, 1998, in index, including reinvestment of dividends. Indexes calculated
on month-end basis.
38
Source: NVIDIA CORP, 10-K, March 13, 2009 Powered by Morningstar® Document Research℠