NVIDIA 2009 Annual Report Download - page 106
Download and view the complete annual report
Please find page 106 of the 2009 NVIDIA annual report below. You can navigate through the pages in the report by either clicking on the pages listed below, or by using the keyword search tool below to find specific information within the annual report.-
 1
1 -
2
-
3
-
4
-
5
-
6
-
7
-
8
-
9
-
10
-
11
-
12
-
13
-
14
-
15
-
16
-
17
-
18
-
19
-
20
-
21
-
22
-
23
-
24
-
25
-
26
-
27
-
28
-
29
-
30
-
31
-
32
-
33
-
34
-
35
-
36
-
37
-
38
-
39
-
40
-
41
-
42
-
43
-
44
-
45
-
46
-
47
-
48
-
49
-
50
-
51
-
52
-
53
-
54
-
55
-
56
-
57
-
58
-
59
-
60
-
61
-
62
-
63
-
64
-
65
-
66
-
67
-
68
-
69
-
70
-
71
-
72
-
73
-
74
-
75
-
76
-
77
-
78
-
79
-
80
-
81
-
82
-
83
-
84
-
85
-
86
-
87
-
88
-
89
-
90
-
91
-
92
-
93
-
94
-
95
-
 96
96 -
 97
97 -
 98
98 -
 99
99 -
 100
100 -
 101
101 -
 102
102 -
 103
103 -
 104
104 -
 105
105 -
 106
106 -
 107
107 -
 108
108 -
 109
109 -
 110
110 -
 111
111 -
 112
112 -
 113
113 -
 114
114 -
 115
115 -
 116
116 -
117
-
118
-
119
-
120
-
121
-
122
-
123
-
124
-
125
-
126
-
127
-
128
-
129
-
130
-
131
-
132
-
133
-
134
-
135
-
136
-
137
-
138
-
139
-
140
-
141
 |
 |
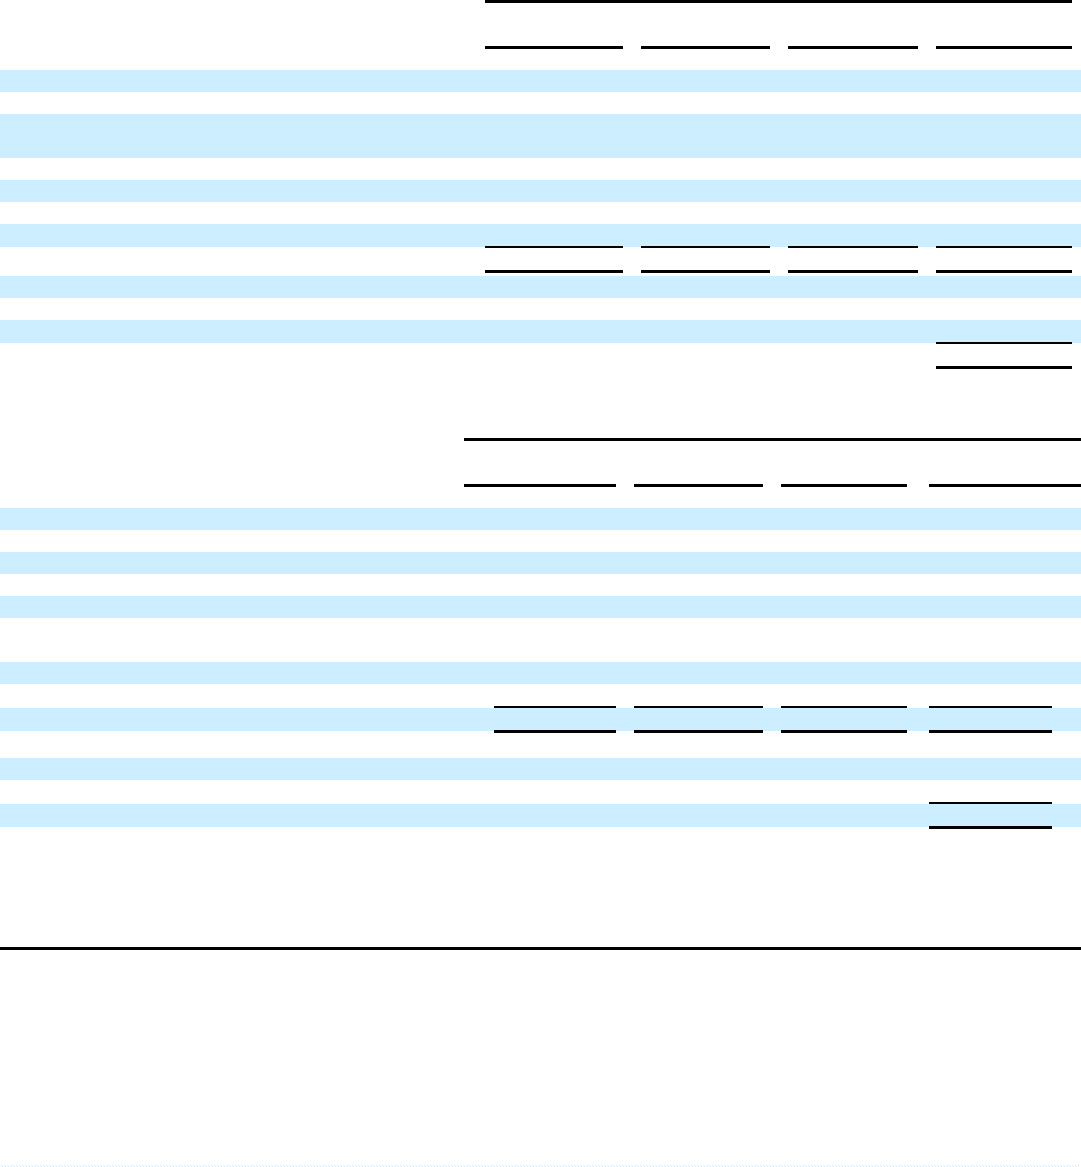
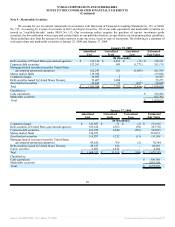
NVIDIA CORPORATION AND SUBSIDIARIES
NOTES TO THE CONSOLIDATED FINANCIAL STATEMENTS
(Continued)
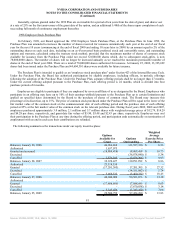
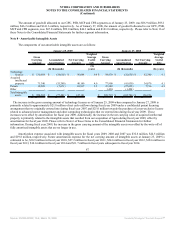
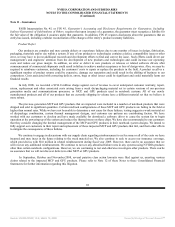
Note 9 - Marketable Securities
We account for our investment instruments in accordance with Statement of Financial Accounting Standards No. 115, or SFAS
No. 115, Accounting for Certain Investments in Debt and Equity Securities. All of our cash equivalents and marketable securities are
treated as “available-for-sale” under SFAS No. 115. Our investment policy requires the purchase of top-tier investment grade
securities, the diversification of asset type and certain limits on our portfolio duration, as specified in our investment policy guidelines.
These guidelines also limit the amount of credit exposure to any one issue, issuer or type of instrument. The following is a summary of
cash equivalents and marketable securities at January 25, 2009 and January 27, 2008:
January 25, 2009
Amortized
Cost
Unrealized
Gain
Unrealized
Loss
Estimated
Fair Value
(In thousands)
Debt securities of United States government agencies $ 313,319 $ 4,815 $ (13) $ 318,121
Corporate debt securities 252,265 680 (1,771) 251,174
Mortgage backed securities issued by United States
government-sponsored enterprises 162,243 361 (1,405) 161,199
Money market funds 139,046 - - 139,046
Commercial paper 56,995 2 - 56,997
Debt securities issued by United States Treasury 53,407 1,868 - 55,275
Asset-backed securities 39,014 71 (227) 38,858
Total $ 1,016,289 $ 7,797 $ (3,416) $ 1,020,670
Classified as:
Cash equivalents $ 182,968
Marketable securities 837,702
Total $ 1,020,670
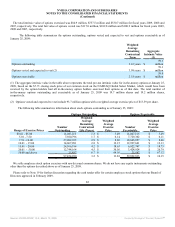
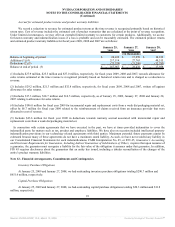
January 27, 2008
Amortized
Cost
Unrealized
Gain
Unrealized
Loss
Estimated
Fair Value
(In thousands)
Commercial paper $ 513,887 $ 31 $ (2) $ 513,916
Debt securities of United States government agencies 363,434 4,365 (69) 367,730
Corporate debt securities 361,452 2,844 (281) 364,015
Money market funds 218,055 - - 218,055
Asset-backed securities 110,287 1,232 (11) 111,508
Mortgage backed securities issued by United States
government-sponsored enterprises 69,620 769 (5) 70,384
Debt securities issued by United States Treasury 29,327 256 - 29,583
Equity securities 2,491 1,613 - 4,104
Total $ 1,668,553 $ 11,110 $ (368) $ 1,679,295
Classified as:
Cash equivalents $ 596,786
Marketable securities 1,082,509
Total $ 1,679,295
88
Source: NVIDIA CORP, 10-K, March 13, 2009 Powered by Morningstar® Document Research℠