NVIDIA 2009 Annual Report Download - page 64
Download and view the complete annual report
Please find page 64 of the 2009 NVIDIA annual report below. You can navigate through the pages in the report by either clicking on the pages listed below, or by using the keyword search tool below to find specific information within the annual report.-
 1
1 -
2
-
3
-
4
-
5
-
6
-
7
-
8
-
9
-
10
-
11
-
12
-
13
-
14
-
15
-
16
-
17
-
18
-
19
-
20
-
21
-
22
-
23
-
24
-
25
-
26
-
27
-
28
-
29
-
30
-
31
-
32
-
33
-
34
-
35
-
36
-
37
-
38
-
39
-
40
-
41
-
42
-
43
-
44
-
45
-
46
-
47
-
48
-
49
-
50
-
51
-
52
-
53
-
 54
54 -
 55
55 -
 56
56 -
 57
57 -
 58
58 -
 59
59 -
 60
60 -
 61
61 -
 62
62 -
 63
63 -
 64
64 -
 65
65 -
 66
66 -
 67
67 -
 68
68 -
 69
69 -
 70
70 -
 71
71 -
 72
72 -
 73
73 -
 74
74 -
75
-
76
-
77
-
78
-
79
-
80
-
81
-
82
-
83
-
84
-
85
-
86
-
87
-
88
-
89
-
90
-
91
-
92
-
93
-
94
-
95
-
96
-
97
-
98
-
99
-
100
-
101
-
102
-
103
-
104
-
105
-
106
-
107
-
108
-
109
-
110
-
111
-
112
-
113
-
114
-
115
-
116
-
117
-
118
-
119
-
120
-
121
-
122
-
123
-
124
-
125
-
126
-
127
-
128
-
129
-
130
-
131
-
132
-
133
-
134
-
135
-
136
-
137
-
138
-
139
-
140
-
141
 |
 |

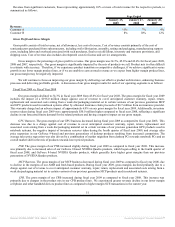
Fiscal Year 2008 vs. Fiscal Year 2007
GPU Business. The gross margin of our GPU business increased during fiscal year 2008 as compared to fiscal year 2007. This
increase was primarily due to increased sales of our GeForce 8-series GPUs, which began selling in the third quarter of fiscal year
2007. Our GeForce 8-series GPUs generally have higher gross margins than our previous generations of GPUs. Additionally, the more
favorable costs of memory purchases during fiscal year 2008, positively impacted our gross margin.
PSB. The gross margin of our PSB increased during fiscal year 2008 as compared to fiscal year 2007. This increase was
primarily due to increased sales of our GeForce 8-based NVIDIA Quadro products, which began selling in the fourth quarter of fiscal
year 2007 and generally have higher gross margins than our previous generations of NVIDIA Quadro products.
MCP Business. The gross margin of our MCP business increased during fiscal year 2008 as compared to fiscal year 2007. This
increase was primarily due to a shift in product mix towards Intel-based platform products, which began to ramp up shipments after
the third quarter of fiscal year 2007, and inventory reserves that we recorded as a charge to cost of revenue during the first quarter of
fiscal year 2007 of approximately $4.1 million related to certain NVIDIA nForce purchase commitments that we believed had
exceeded future demand.
CPB. The gross margin of our CPB decreased during fiscal year 2008 as compared to fiscal year 2007. This decrease was
primarily due to a drop in gross profit realized from sales of our high-end feature cellular phone and other handheld
devices. However, increased royalties from SCE during fiscal year 2008, offset the decreases.
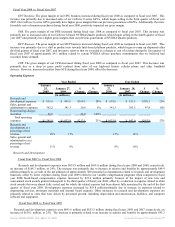
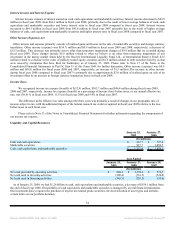
Operating Expenses
Year Ended Year Ended
January
25,
2009
January 27,
2008
$
Change
%
Change
January
27,
2008
January 28,
2007
$
Change
%
Change
(In millions) (In millions)
Research and
development expenses $ 855.9 $ 691.6 $164.3 24% $ 691.6 $ 553.5 $138.1 25%
Sales, general and
administrative expenses 362.2 341.3 20.9 6% 341.3 293.5 47.8 16%
Restructuring charges
and other 26.9 - 26.9 100% - - - -
Total operating
expenses $ 1,245.0 $ 1,032.9 $212.1 21% $1,032.9 $ 847.0 $185.9 22%
Research and
development as a
percentage of net
revenue 25% 17% 17% 18%
Sales, general and
administrative as a
percentage of net
revenue 11% 8% 8% 10%
Research and Development
Fiscal Year 2009 vs. Fiscal Year 2008
Research and development expenses were $855.9 million and $691.6 million during fiscal years 2009 and 2008, respectively,
an increase of $164.3 million, or 24%. The increase was primarily due to increase in salaries and benefits by approximately $64.9
million primarily as a result of the net addition of approximately 500 personnel in departments related to research and development
functions, offset by lower expenses during fiscal year 2009 related to our variable compensation programs when compared to fiscal
year 2008. Stock-based compensation expense increased by $21.4 million primarily because of the impact of new hire and
semi-annual stock awards granted subsequent to the third quarter of fiscal year 2008, offset by a reduction in expense related to older
stock awards that were almost fully vested and for which the related expense had been almost fully amortized by the end of the first
quarter of fiscal year 2009. Development expenses increased by $18.8 million primarily due to increase in expenses related to
engineering services, prototype materials and internal board requests. Other increases in research and development expenses are
primarily related to costs that were driven by personnel growth, including depreciation and amortization, facilities, and computer
software and equipment.
Fiscal Year 2008 vs. Fiscal Year 2007
Research and development expenses were $691.6 million and $553.5 million during fiscal years 2008 and 2007, respectively, an
increase of $138.1 million, or 25%. The increase is primarily related to an increase in salaries and benefits by approximately $95.3
Source: NVIDIA CORP, 10-K, March 13, 2009 Powered by Morningstar® Document Research℠