NVIDIA 2009 Annual Report Download - page 67
Download and view the complete annual report
Please find page 67 of the 2009 NVIDIA annual report below. You can navigate through the pages in the report by either clicking on the pages listed below, or by using the keyword search tool below to find specific information within the annual report.-
 1
1 -
2
-
3
-
4
-
5
-
6
-
7
-
8
-
9
-
10
-
11
-
12
-
13
-
14
-
15
-
16
-
17
-
18
-
19
-
20
-
21
-
22
-
23
-
24
-
25
-
26
-
27
-
28
-
29
-
30
-
31
-
32
-
33
-
34
-
35
-
36
-
37
-
38
-
39
-
40
-
41
-
42
-
43
-
44
-
45
-
46
-
47
-
48
-
49
-
50
-
51
-
52
-
53
-
54
-
55
-
56
-
 57
57 -
 58
58 -
 59
59 -
 60
60 -
 61
61 -
 62
62 -
 63
63 -
 64
64 -
 65
65 -
 66
66 -
 67
67 -
 68
68 -
 69
69 -
 70
70 -
 71
71 -
 72
72 -
 73
73 -
 74
74 -
 75
75 -
 76
76 -
 77
77 -
78
-
79
-
80
-
81
-
82
-
83
-
84
-
85
-
86
-
87
-
88
-
89
-
90
-
91
-
92
-
93
-
94
-
95
-
96
-
97
-
98
-
99
-
100
-
101
-
102
-
103
-
104
-
105
-
106
-
107
-
108
-
109
-
110
-
111
-
112
-
113
-
114
-
115
-
116
-
117
-
118
-
119
-
120
-
121
-
122
-
123
-
124
-
125
-
126
-
127
-
128
-
129
-
130
-
131
-
132
-
133
-
134
-
135
-
136
-
137
-
138
-
139
-
140
-
141
 |
 |

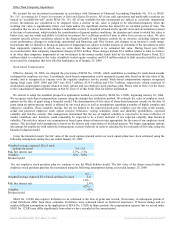
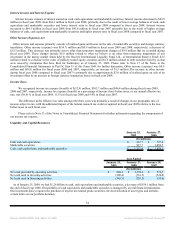
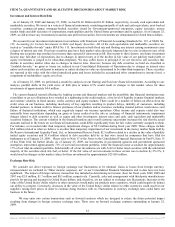
Interest Income and Interest Expense
Interest income consists of interest earned on cash, cash equivalents and marketable securities. Interest income decreased to $42.9
million in fiscal year 2009, from $64.3 million in fiscal year 2008, primarily due to the result of lower average balances of cash, cash
equivalents and marketable securities and lower interest rates in fiscal year 2009 compared to fiscal year 2008. Interest income
increased to $64.3 million in fiscal year 2008 from $41.8 million in fiscal year 2007 primarily due to the result of higher average
balances of cash, cash equivalents and marketable securities and higher interest rates in fiscal year 2008 compared to fiscal year 2007.
Other Income (Expense), net
Other income and expense primarily consists of realized gains and losses on the sale of marketable securities and foreign currency
translation. Other income (expense) was $(14.7) million and $0.8 million in fiscal years 2009 and 2008, respectively, a decrease of
$15.5 million. This decrease was primarily due to other than temporary impairment charges of $9.9 million that we recorded during
fiscal year 2009. These charges include $5.6 million related to what we believe is an other than temporary impairment of our
investment in the money market funds held by the Reserve International Liquidity Fund, Ltd., or International Reserve Fund; $2.5
million related to a decline in the value of publicly traded equity securities and $1.8 million related to debt securities held by us that
were issued by companies that have filed for bankruptcy as of January 25, 2009. Please refer to Note 17 of the Notes to the
Consolidated Financial Statements in Part IV, Item 15 of this Form 10-K for further discussion. Other income (expense) was $0.8
million and $(0.8) million for fiscal years 2008 and 2007, respectively, an increase of $1.5 million. The increase in other income
during fiscal year 2008 compared to fiscal year 2007 is primarily due to approximately $2.0 million of realized gains on sale of an
investment offset by an increase in foreign currency transaction losses in fiscal year 2008.
Income Taxes
We recognized income tax expense (benefit) of $(12.9) million, $103.7 million and $46.4 million during fiscal years 2009,
2008 and 2007, respectively. Income tax expense (benefit) as a percentage of income (loss) before taxes, or our annual effective tax
rate, was (30.0) % in fiscal year 2009, 11.5% in fiscal year 2008 and 9.4% in fiscal year 2007.
The difference in the effective tax rates amongst the three years was primarily a result of changes in our geographic mix of
income subject to tax, with the additional impact of the federal research tax credit recognized in fiscal year 2009 relative to the loss
before taxes in such fiscal year.
Please refer to Note 13 of the Notes to Consolidated Financial Statements for further information regarding the components of
our income tax expense.
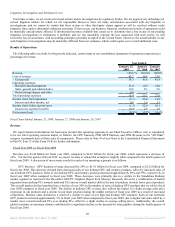
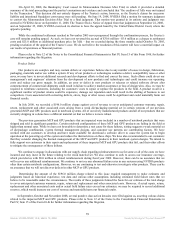
Liquidity and Capital Resources
January 25,
2009
January 27,
2008
(In millions)
Cash and cash equivalents $ 417.7 $ 727.0
Marketable securities 837.7 1,082.5
Cash, cash equivalents, and marketable securities $ 1,255.4 $ 1,809.5
Year Ended
January 25, January 27, January 28,
2009 2008 2007
(In millions)
Net cash provided by operating activities $ 249.4 $ 1,270.2 $ 572.7
Net cash used in investing activities (209.4) (761.3) (526.4)
Net cash used in financing activities (349.3) (326.3) (53.6)
As of January 25, 2009, we had $1.26 billion in cash, cash equivalents and marketable securities, a decrease of $554.1 million from
the end of fiscal year 2008. Our portfolio of cash equivalents and marketable securities is managed by several financial institutions.
Our investment policy requires the purchase of top-tier investment grade securities, the diversification of asset types and includes
certain limits on our portfolio duration.
54
Source: NVIDIA CORP, 10-K, March 13, 2009 Powered by Morningstar® Document Research℠