NVIDIA 2009 Annual Report Download - page 108
Download and view the complete annual report
Please find page 108 of the 2009 NVIDIA annual report below. You can navigate through the pages in the report by either clicking on the pages listed below, or by using the keyword search tool below to find specific information within the annual report.-
 1
1 -
2
-
3
-
4
-
5
-
6
-
7
-
8
-
9
-
10
-
11
-
12
-
13
-
14
-
15
-
16
-
17
-
18
-
19
-
20
-
21
-
22
-
23
-
24
-
25
-
26
-
27
-
28
-
29
-
30
-
31
-
32
-
33
-
34
-
35
-
36
-
37
-
38
-
39
-
40
-
41
-
42
-
43
-
44
-
45
-
46
-
47
-
48
-
49
-
50
-
51
-
52
-
53
-
54
-
55
-
56
-
57
-
58
-
59
-
60
-
61
-
62
-
63
-
64
-
65
-
66
-
67
-
68
-
69
-
70
-
71
-
72
-
73
-
74
-
75
-
76
-
77
-
78
-
79
-
80
-
81
-
82
-
83
-
84
-
85
-
86
-
87
-
88
-
89
-
90
-
91
-
92
-
93
-
94
-
95
-
96
-
97
-
 98
98 -
 99
99 -
 100
100 -
 101
101 -
 102
102 -
 103
103 -
 104
104 -
 105
105 -
 106
106 -
 107
107 -
 108
108 -
 109
109 -
 110
110 -
 111
111 -
 112
112 -
 113
113 -
 114
114 -
 115
115 -
 116
116 -
 117
117 -
 118
118 -
119
-
120
-
121
-
122
-
123
-
124
-
125
-
126
-
127
-
128
-
129
-
130
-
131
-
132
-
133
-
134
-
135
-
136
-
137
-
138
-
139
-
140
-
141
 |
 |
NVIDIA CORPORATION AND SUBSIDIARIES
NOTES TO THE CONSOLIDATED FINANCIAL STATEMENTS
(Continued)
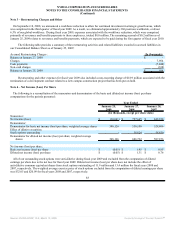
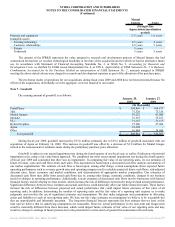
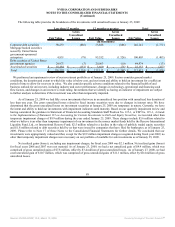
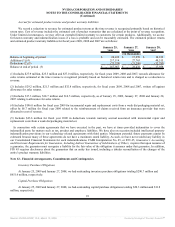
The amortized cost and estimated fair value of cash equivalents and marketable securities which are primarily debt instruments,
are classified as available-for-sale at January 25, 2009 and January 27, 2008 and are shown below by contractual maturity.
January 25, 2009 January 27, 2008
Amortized
Cost
Estimated
Fair Value
Amortized
Cost
Estimated
Fair Value
(In thousands)
Less than one year $ 484,869 $ 484,616 $ 1,141,725 $ 1,144,021
Due in 1 - 5 years 369,177 374,855 454,717 460,786
Due in 6 - 7 years - - - -
Mortgage-backed securities issued by
government-sponsored enterprises not due at a single
maturity date 162,243 161,199 69,620 70,384
Total $ 1,016,289 $ 1,020,670 $ 1,666,062 $ 1,675,191
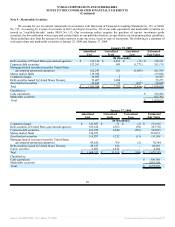
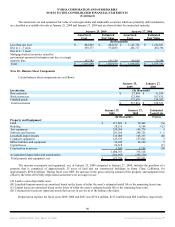
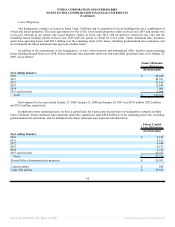
Note 10 - Balance Sheet Components
Certain balance sheet components are as follows:
January 25,
2009
January 27,
2008
Inventories: (In thousands)
Raw materials $ 27,804 $ 31,299
Work in-process 132,960 107,835
Finished goods 377,070 219,387
Total inventories $ 537,834 $ 358,521
January 25,
2009
January 27,
2008
Estimated
Useful Life
(In thousands) (Years)
Property and Equipment:
Land $ 217,866 $ 38,442 (A)
Building 29,216 4,104 3-25
Test equipment 234,368 186,774 3
Software and licenses 201,560 246,725 3 - 5
Leasehold improvements 136,008 103,353 (B)
Computer equipment 125,533 137,642 3
Office furniture and equipment 32,224 28,220 5
Capital leases 26,618 - (C)
Construction in process 5,360 8,258 (D)
1,008,753 753,518
Accumulated depreciation and amortization (382,955) (393,710)
Total property and equipment, net $ 625,798 $ 359,808
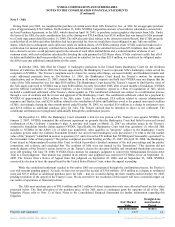
The increase in property and equipment, net, at January 25, 2009 compared to January 27, 2008, includes the purchase of a
property that is comprised of approximately 25 acres of land and ten commercial buildings in Santa Clara, California, for
approximately $194.8 million. During fiscal year 2009, the increase in the gross carrying amount of the property and equipment was
offset by the write-off of fully depreciated assets that were no longer in use.
(A) Land is a non-depreciable asset.
(B) Leasehold improvements are amortized based on the lesser of either the asset’s estimated useful life or the remaining lease term.
(C) Capital leases are amortized based on the lesser of either the asset’s estimated useful life or the remaining lease term.
(D) Construction in process represents assets that are not in service as of the balance sheet date.
Depreciation expense for fiscal years 2009, 2008 and 2007 was $152.4 million, $111.0 million and $88.0 million, respectively.
90
Source: NVIDIA CORP, 10-K, March 13, 2009 Powered by Morningstar® Document Research℠