NVIDIA 2009 Annual Report Download - page 103
Download and view the complete annual report
Please find page 103 of the 2009 NVIDIA annual report below. You can navigate through the pages in the report by either clicking on the pages listed below, or by using the keyword search tool below to find specific information within the annual report.-
 1
1 -
2
-
3
-
4
-
5
-
6
-
7
-
8
-
9
-
10
-
11
-
12
-
13
-
14
-
15
-
16
-
17
-
18
-
19
-
20
-
21
-
22
-
23
-
24
-
25
-
26
-
27
-
28
-
29
-
30
-
31
-
32
-
33
-
34
-
35
-
36
-
37
-
38
-
39
-
40
-
41
-
42
-
43
-
44
-
45
-
46
-
47
-
48
-
49
-
50
-
51
-
52
-
53
-
54
-
55
-
56
-
57
-
58
-
59
-
60
-
61
-
62
-
63
-
64
-
65
-
66
-
67
-
68
-
69
-
70
-
71
-
72
-
73
-
74
-
75
-
76
-
77
-
78
-
79
-
80
-
81
-
82
-
83
-
84
-
85
-
86
-
87
-
88
-
89
-
90
-
91
-
92
-
 93
93 -
 94
94 -
 95
95 -
 96
96 -
 97
97 -
 98
98 -
 99
99 -
 100
100 -
 101
101 -
 102
102 -
 103
103 -
 104
104 -
 105
105 -
 106
106 -
 107
107 -
 108
108 -
 109
109 -
 110
110 -
 111
111 -
 112
112 -
 113
113 -
114
-
115
-
116
-
117
-
118
-
119
-
120
-
121
-
122
-
123
-
124
-
125
-
126
-
127
-
128
-
129
-
130
-
131
-
132
-
133
-
134
-
135
-
136
-
137
-
138
-
139
-
140
-
141
 |
 |

NVIDIA CORPORATION AND SUBSIDIARIES
NOTES TO THE CONSOLIDATED FINANCIAL STATEMENTS
(Continued)
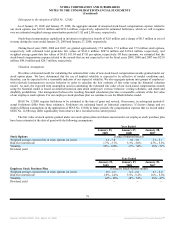
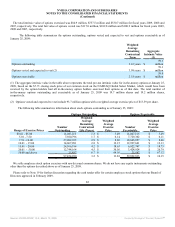
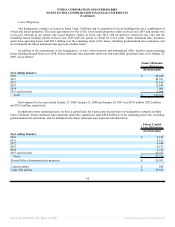
Mental
Images Ageia
(Straight-line
depreciation/amortization
period)
Property and equipment 2 -5 years 1-2 years
Intangible assets:
Existing technology 4-5 years 4 years
Customer relationships 4-5 years 5 years
Patents 5 years -
Trademark 5 years 5 years
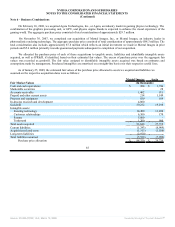
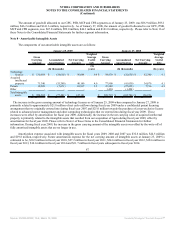
The amount of the IPR&D represents the value assigned to research and development projects of Mental Images that had
commenced but had not yet reached technological feasibility at the time of the acquisition and for which we had no alternative future
use. In accordance with Statement of Financial Accounting Standards No. 2, or SFAS No. 2, Accounting for Research and
Development Costs, as clarified by FASB issued Interpretation No. 4, or FIN 4, Applicability of FASB Statement No. 2 to Business
Combinations Accounted for by the Purchase Method an interpretation of FASB Statement No. 2 , amounts assigned to IPR&D
meeting the above-stated criteria were charged to research and development expenses as part of the allocation of the purchase price.
The pro forma results of operations for our acquisitions during fiscal years 2009 and 2008 have not been presented because the
effects of the acquisitions, individually or in the aggregate, were not material to our results.
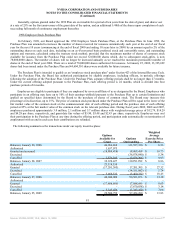
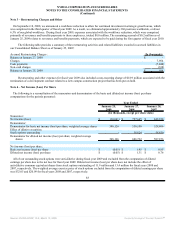
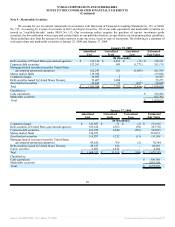
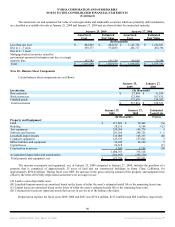
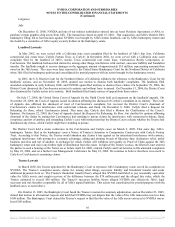
Note 7 - Goodwill
The carrying amount of goodwill is as follows:
January 25,
2009
January 27,
2008
(In thousands)
PortalPlayer $ 104,896 $ 104,473
3dfx 75,326 75,326
Mental Images 59,252 63,086
MediaQ 35,167 35,167
ULi 31,115 31,115
Hybrid Graphics 27,906 27,906
Ageia 19,198 -
Other 16,984 16,984
Total goodwill $ 369,844 $ 354,057
During fiscal year 2009, goodwill increased by $15.8 million, primarily due to $19.2 million of goodwill associated with our
acquisition of Ageia on February 10, 2008. This increase in goodwill was offset by a decrease of $3.8 million for Mental Images
related to the reassessment of estimates made during the preliminary purchase price allocation.
Goodwill is subject to our annual impairment test during the fourth quarter of our fiscal year, or earlier if indicators of potential
impairment exist, using a fair value-based approach. We completed our most recent annual impairment test during the fourth quarter
of fiscal year 2009 and concluded that there was no impairment. In computing fair value of our reporting units, we use estimates of
future revenues, costs and cash flows from such units. This assessment is based upon a discounted cash flow analysis and analysis of
our market capitalization. The estimate of cash flow is based upon, among other things, certain assumptions about expected future
operating performance such as revenue growth rates and operating margins used to calculate projected future cash flows, risk-adjusted
discount rates, future economic and market conditions, and determination of appropriate market comparables. Our estimates of
discounted cash flows may differ from actual cash flows due to, among other things, economic conditions, changes to our business
model or changes in operating performance. Additionally, certain estimates of discounted cash flows involve businesses with limited
financial history and developing revenue models, which increase the risk of differences between the projected and actual performance.
Significant differences between these estimates and actual cash flows could materially affect our future financial results. These factors
increase the risk of differences between projected and actual performance that could impact future estimates of fair value of all
reporting units. In addition, determining the number of reporting units and the fair value of a reporting unit requires us to make
judgments and involves the use of significant estimates and assumptions. We also make judgments and assumptions in allocating
assets and liabilities to each of our reporting units. We base our fair value estimates on assumptions we believe to be reasonable but
that are unpredictable and inherently uncertain. The long-term financial forecast represents the best estimate that we have at this
time and we believe that its underlying assumptions are reasonable. However, actual performance in the near-term and longer-term
could be materially different from these forecasts, which could impact future estimates of fair value of our reporting units and may
result in a charge to earnings in future periods due to the potential for a write-down of goodwill in connection with such tests.
Source: NVIDIA CORP, 10-K, March 13, 2009 Powered by Morningstar® Document Research℠