NVIDIA 2006 Annual Report Download - page 97
Download and view the complete annual report
Please find page 97 of the 2006 NVIDIA annual report below. You can navigate through the pages in the report by either clicking on the pages listed below, or by using the keyword search tool below to find specific information within the annual report.-
 1
1 -
2
-
3
-
4
-
5
-
6
-
7
-
8
-
9
-
10
-
11
-
12
-
13
-
14
-
15
-
16
-
17
-
18
-
19
-
20
-
21
-
22
-
23
-
24
-
25
-
26
-
27
-
28
-
29
-
30
-
31
-
32
-
33
-
34
-
35
-
36
-
37
-
38
-
39
-
40
-
41
-
42
-
43
-
44
-
45
-
46
-
47
-
48
-
49
-
50
-
51
-
52
-
53
-
54
-
55
-
56
-
57
-
58
-
59
-
60
-
61
-
62
-
63
-
64
-
65
-
66
-
67
-
68
-
69
-
70
-
71
-
72
-
73
-
74
-
75
-
76
-
77
-
78
-
79
-
80
-
81
-
82
-
83
-
84
-
85
-
86
-
 87
87 -
 88
88 -
 89
89 -
 90
90 -
 91
91 -
 92
92 -
 93
93 -
 94
94 -
 95
95 -
 96
96 -
 97
97 -
 98
98 -
 99
99 -
 100
100 -
 101
101 -
 102
102 -
 103
103 -
 104
104 -
 105
105 -
 106
106 -
 107
107 -
108
-
109
-
110
-
111
-
112
-
113
-
114
-
115
-
116
-
117
-
118
-
119
-
120
-
121
-
122
-
123
-
124
-
125
-
126
-
127
-
128
-
129
-
130
-
131
-
132
-
133
-
134
-
135
-
136
 |
 |

NVIDIA CORPORATION AND SUBSIDIARIES
NOTES TO CONSOLIDATED FINANCIAL STATEMENTS − (Continued)
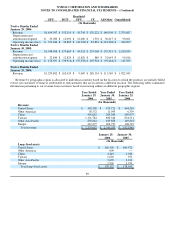
GPU MCP Handheld
GPU CE All Other Consolidated
(In thousands)
Twelve Months Ended
January 29, 2006:
Revenue $1,654,397 $ 352,319 $ 58,745 $ 170,222 $ 140,004 $ 2,375,687
Depreciation and
amortization expense $ 33,080 $ 12,092 $ 12,480 $ 1,552 $ 30,817 $ 90,021
Operating income (loss) $ 370,636 $ 32,865 $ (34,922) $ 83,881 $ (112,363) $ 340,097
Twelve Months Ended
January 30, 2005:
Revenue $1,348,968 $ 175,663 $ 45,921 $ 259,968 $ 179,513 $ 2,010,033
Depreciation and
amortization expense $ 32,849 $ 12,824 $ 11,620 $ 880 $ 32,643 $ 90,816
Operating income (loss) $ 178,597 $ (39,912) $ (37,532) $ 107,901 $ (95,461) $ 113,593
Twelve Months Ended
January 25, 2004:
Revenue $1,259,802 $ 162,435 $ 9,009 $ 280,134 $ 111,565 $ 1,822,945
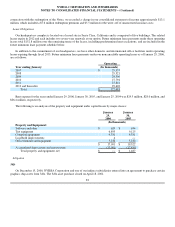
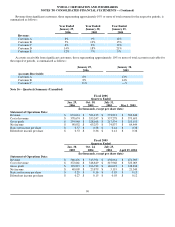
Revenue by geographic region is allocated to individual countries based on the location to which the products are initially billed
even if our customers' revenue is attributable to end customers that are located in a different location. The following tables summarize
information pertaining to our revenue from customers based on invoicing address in different geographic regions:
Year Ended Year Ended Year Ended
January 29, January 30, January 25,
2006 2005 2004
(In thousands)
Revenue:
United States $ 340,598 $ 473,721 $ 444,510
Other Americas 38,572 11,045 6,359
China 401,612 269,306 280,975
Taiwan 1,131,784 883,346 834,511
Other Asia Pacific 250,844 169,888 149,843
Europe 212,277 202,727 106,747
Total revenue $ 2,375,687 $ 2,010,033 $ 1,822,945
January 29, January 30,
2006 2005
(In thousands)
Long−lived assets
United States $ 161,505 $ 169,872
Other Americas 609 −−
China 4,443 1,030
Taiwan 1,020 951
Other Asia Pacific 7,670 3,123
Europe 2,905 3,979
Total long−lived assets $ 178,152 $ 178,955
89