NVIDIA 2006 Annual Report Download - page 49
Download and view the complete annual report
Please find page 49 of the 2006 NVIDIA annual report below. You can navigate through the pages in the report by either clicking on the pages listed below, or by using the keyword search tool below to find specific information within the annual report.-
 1
1 -
2
-
3
-
4
-
5
-
6
-
7
-
8
-
9
-
10
-
11
-
12
-
13
-
14
-
15
-
16
-
17
-
18
-
19
-
20
-
21
-
22
-
23
-
24
-
25
-
26
-
27
-
28
-
29
-
30
-
31
-
32
-
33
-
34
-
35
-
36
-
37
-
38
-
 39
39 -
 40
40 -
 41
41 -
 42
42 -
 43
43 -
 44
44 -
 45
45 -
 46
46 -
 47
47 -
 48
48 -
 49
49 -
 50
50 -
 51
51 -
 52
52 -
 53
53 -
 54
54 -
 55
55 -
 56
56 -
 57
57 -
 58
58 -
 59
59 -
60
-
61
-
62
-
63
-
64
-
65
-
66
-
67
-
68
-
69
-
70
-
71
-
72
-
73
-
74
-
75
-
76
-
77
-
78
-
79
-
80
-
81
-
82
-
83
-
84
-
85
-
86
-
87
-
88
-
89
-
90
-
91
-
92
-
93
-
94
-
95
-
96
-
97
-
98
-
99
-
100
-
101
-
102
-
103
-
104
-
105
-
106
-
107
-
108
-
109
-
110
-
111
-
112
-
113
-
114
-
115
-
116
-
117
-
118
-
119
-
120
-
121
-
122
-
123
-
124
-
125
-
126
-
127
-
128
-
129
-
130
-
131
-
132
-
133
-
134
-
135
-
136
 |
 |

fiscal 2005 GPU Business revenue. In addition, average selling prices from our notebook GeForce 7 and GeForce 6 series GPU
products increased as a larger percentage of our total notebook revenue during fiscal 2006 as compared to fiscal 2005.
MCP Business. The gross margin of our MCP Business increased during fiscal 2006 as compared to fiscal 2005, primarily due to
the increase in revenue from sales of our NVIDIA nForce3 and NVIDIA nForce4 products, which to date have experienced higher
gross margins than previous generations of NVIDIA nForce products.
Handheld GPU Business. The gross margin of our Handheld GPU Business increased during fiscal 2006 as compared to fiscal
2005, primarily due to the inventory write−off of certain handheld products in the third quarter of fiscal 2005.
Consumer Electronics Business. The gross margin of our Consumer Electronics Business increased during fiscal 2006 as
compared to fiscal 2005, primarily due to the reduction of die costs for Xbox−related products, and the recognition of revenue from
our contractual arrangements with SCE to jointly develop a custom GPU incorporating our next−generation GeForce GPU and SCE's
system solutions in SCE's PlayStation3.
Fiscal Year 2005 vs. Fiscal Year 2004
GPU Business. The gross margin of our GPU Business increased during fiscal 2005 as compared to fiscal 2004. Our GeForce FX
series of GPU products experienced lower gross margins than previous series of GeForce GPU products, such as the GeForce 4 series.
Company−wide efforts were made to drive down cost and improve gross margin and, as a result, during fiscal 2005, we were able to
improve our gross margin. In addition, in fiscal 2005, we realized increased sales of our performance GeForce FX desktop GPU
products and began shipping our GeForce 6 series GPUs, which are among our highest gross margin products. Finally, revenue from
our NVIDIA Quadro professional workstation products, which typically provide the highest gross margins of any of our products,
increased as a percentage of our total revenue during fiscal 2005. This increase in our mix of revenue toward higher−margin products
led to a positive impact on our overall gross margin.
MCP Business. The gross margin of our MCP Business increased during the fiscal 2005 as compared fiscal 2004 primarily due to
the increase in revenue from sales of our NVIDIA nForce3 and NVIDIA nForce4 products, which to date have experienced higher
gross margins than our previous generations of NVIDIA nForce products.
Handheld GPU Business. The gross margin of our Handheld GPU Business decreased during fiscal 2005 as compared to fiscal
2004 primarily due to the inventory write−off of certain handheld products in the third quarter of fiscal 2004.
Consumer Electronics Business. The gross margin of our Consumer Electronics Business decreased during fiscal 2005 as
compared to fiscal 2004 primarily due to the pricing settlement with Microsoft that we announced on February 6, 2003 that related to
sales of our Xbox related processors. In addition, during fiscal 2005 we realized a lower average sales price on our sales of Xbox
processors.
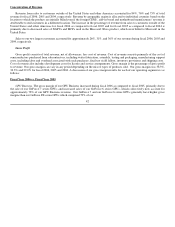
Consolidated Gross Margin
The improvement in our gross margin reflects our continuing focus on delivering cost effective product architectures, enhancing
business processes and delivering profitable growth. We expect gross margin to improve by approximately 0.5% to 1.0% during the
first quarter of fiscal 2007.
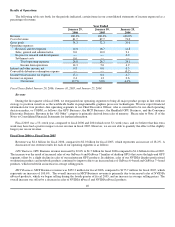
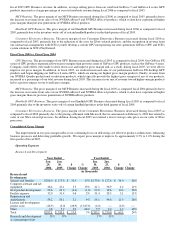
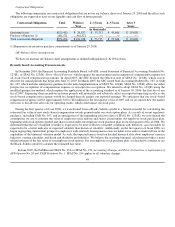
Operating Expenses
Research and Development
Year Ended Year Ended
Jan.
29, Jan.
30, $ % Jan.
30, Jan.
25, $ %
2006 2005 Change Change 2005 2004 Change Change
(in thousands)
Research and
Development:
Salaries and benefits $206.0 $ 173.6 $ 32.4 19% $ 173.6 $ 137.6 $ 36.0 26%
Computer software and lab
equipment 46.4 41.1 5.3 13% 41.1 36.9 4.2 11%
New product development 28.6 29.0 (0.4) (1)% 29.0 18.6 10.4 56%
Facility expense 32.0 31.4 0.6 2% 31.4 28.3 3.1 11%
Depreciation and
amortization 58.2 56.1 2.1 4% 56.1 44.6 11.5 26%
License and development
project costs (28.9) (2.0) (26.9) (1,345)% (2.0) −− (2.0) −−
Other 9.8 5.9 3.9 66% 5.9 4.0 1.9 48%
Total $352.1 $ 335.1 $ 17.0 5% $ 335.1 $ 270.0 $ 65.1 24%
Research and development
as a percentage of net 15% 17% 17% 15%